

NMB Bank was traded the most this week; Sabaiko Laghubitta gains 24.83%; both total turnover and transaction rises (Weekly Wrap Up)
Fri, Nov 15, 2019 1:40 PM on NEPSE News, Weekly Analysis, Featured,
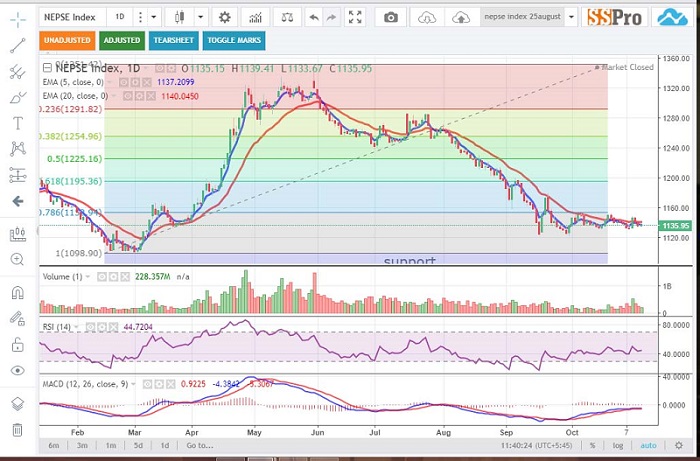
NEPSE Index gained by 3.98 points (0.35%) in the trading week between 10th November to 14th November. This week market opened at 1131.97 points and made a high of 1147.74 on Monday but closed lower at 1135.95 points on Thursday.
Candlestick pattern:
Three red candlestick and two green candlesticks was formed this week.
Exponential Moving Average:
We have used EMA's of 5 days' time period (blue line), 20 days' time period (red line). At present, NEPSE Index is below both 5 days EMA and 20 days EMA. Values below moving average signals for bearishness.
Moving Average Convergence and Divergence:
MACD line (blue) and the signal line (red line) are in negative zone. MACD line rises above the signal line, this indicates a bullish signal, which suggests that the Nepse index is likely to experience upward momentum.
Fibonacci retracement method:
NEPSE Index is trading below 78.6 % Fibonacci level. Trading below 61.8% indicates weight of bear is more than bull.
This week's market statistics:
Index Open-1131.97 points Index closed-1135.95 points
Index High- 1147.74 points Index low- 1129.89 points
Turnover
10 - Nov - 2019: 29.31 crores
11 – Nov - 2019: 54.99 crores
12 – Nov - 2019: 37.98 crores
13 – Nov - 2019: 27.54 crores
14 – Nov - 2019: 22.83 crores
Support and resistance level for next trading week according to Pivot Point.
Pivot Point- 1137 point
1st Resistance-1145 point 1st support-1127 point
2nd Resistance-1155 point 2nd support-1119 point
Conclusion: NEPSE trading above 1150 will indicate for upper momentum in index and trading below 1120 indicates for bearishness. We can expect market to be volatile in up coming week.
Weekly Market Summary of NEPSE
More than 58.28 lakhs unit shares of worth Rs 1.72 arba has been traded through 25.48 thousand transactions this week compared. The current market capitalization of NEPSE stands at Rs. 1,441,435.16 Million.
| This Week (Nov 10-14) | Last Week (Nov 3-7) | % Change | |
|---|---|---|---|
| Total Turnover (Rs.) | 1,726,782,099.00 | 1,232,275,724.00 | 40.13% |
| Total Traded Shares | 5,828,916.00 | 4,650,258.00 | 25.35% |
| Total No. of Transactions | 25,481.00 | 21,185.00 | 20.28% |
| Market Cap at (In million Rs) | 1,441,435.16 | 1,437,291.83 | 0.29% |
| Floated Market Cap at (In million Rs) | 523,498.39 | 521,082.88 | 0.46% |
| No of trading days | 5 | 5 |
Sector-wise breakdown of the turnover of this week:
The commercial bank sector made 54.1% of the total turnover this week followed by microfinance sector with 10.2% of the total turnover.

| Sector | This Week (Nov 10-14) | |
|---|---|---|
| Turnover (Rs in Millions) | Weightage | |
| Commercial Banks | 636.41 | 54.1% |
| Microfinance | 119.74 | 10.2% |
| Manufacturing And Processing | 105.99 | 9.0% |
| Hydro Power | 90.57 | 7.7% |
| Promotor Shares | 71.99 | 6.1% |
| Life Insurance | 37.39 | 3.2% |
| Non Life Insurance | 34.93 | 3.0% |
| Development Banks | 29.34 | 2.5% |
| Tradings | 20.55 | 1.7% |
| Others | 17.63 | 1.5% |
| Finance | 5.23 | 0.4% |
| Hotels | 5.06 | 0.4% |
| Mutual Fund | 1.87 | 0.2% |
| Preference Shares | 0.07 | 0.01% |
NEPSE index and Sub-indices performance: (Increment here is based on the previous week closed value)
The NEPSE index increased by 0.35%. Majority of the indices rises this week meagerly. The top gainer sector of this week is trading sector with the rise of 11.97%. The top looser of the week is development sector which fall of 1.12%.

| Index | This Week | Last Week | Change | % Change Index |
|---|---|---|---|---|
| NEPSE | 1,135.95 | 1,131.97 | 3.98 | 0.35% |
| Sensitive | 250.06 | 248.31 | 1.75 | 0.70% |
| Float | 84.33 | 83.94 | 0.39 | 0.46% |
| Sensitive Float | 80.6 | 79.73 | 0.87 | 1.09% |
| Banking | 1,042.03 | 1,039.18 | 2.85 | 0.27% |
| Development Bank | 1,544.45 | 1,562.02 | -17.57 | -1.12% |
| Finance | 565.22 | 561.01 | 4.21 | 0.75% |
| Hotels | 1,775.48 | 1,782.40 | -6.92 | -0.39% |
| HydroPower | 944.35 | 949.71 | -5.36 | -0.56% |
| Life Insu | 5,015.19 | 5,007.84 | 7.35 | 0.15% |
| Manu. And Processing | 2,450.96 | 2,395.73 | 55.23 | 2.31% |
| Microfinance | 1,492.74 | 1,479.29 | 13.45 | 0.91% |
| Mutual Fund | 9.31 | 9.4 | -0.09 | -0.96% |
| Non Life Insu | 4,158.85 | 4,140.76 | 18.09 | 0.44% |
| Others | 634.42 | 630.6 | 3.82 | 0.61% |
| Trading | 365.45 | 326.39 | 39.06 | 11.97% |
Stock with the highest monthly Beta value from the Banking &Finance Sector
The table below shows the list:
| SN | Stock Symbol | LTP | Monthly Beta | Sector |
|---|---|---|---|---|
| 1 | NMB | 380 | 6.72 | Commercial Bank |
| 2 | NNLB | 463 | 4.34 | Microfinance |
| 3 | GLBSL | 420 | 3.17 | Microfinance |
| 4 | VLBS | 589 | 2.73 | Microfinance |
| 5 | GFCL | 139 | 2.71 | Finance |
| 6 | BFC | 92 | 2.67 | Finance |
| 7 | MSLB | 866 | 2.6 | Microfinance |
| 8 | SMFBS | 785 | 2.58 | Microfinance |
| 9 | SMFDB | 503 | 2.58 | Microfinance |
| 10 | NADEP | 406 | 2.43 | Microfinance |
NMB Bank Limited (NMB) has the highest monthly Beta value of 6.72 followed by Naya Nepal Laghubitta (NNLB) with 4.34 beta value.

All the analysis are done with the SS Pro Software. To know more about the software click on the link below
Top Ten Gainers of the week:
Sabaiko Laghubitta Bittiya Sanstha (SABSL) is the top gainer of the week. SABSL closed at Rs 563 with Rs 112 (24.83%) increment.
| S.N. | Symbol | Open Price (Rs.) | Closing Price (Rs.) | Change (Rs.) | Change (%) |
|---|---|---|---|---|---|
| 1 | SABSL | 451 | 563 | 112 | 24.83 |
| 2 | STC | 795 | 943 | 148 | 18.62 |
| 3 | HDL | 1,519 | 1,799.00 | 280 | 18.43 |
| 4 | GGBSL | 335 | 395 | 60 | 17.91 |
| 5 | RADHI | 133 | 150 | 17 | 12.78 |
| 6 | NMB | 347 | 380 | 33 | 9.51 |
| 7 | UPCL | 72 | 78 | 6 | 8.33 |
| 8 | ALBSL | 383 | 409 | 26 | 6.79 |
| 9 | GMFBS | 451 | 480 | 29 | 6.43 |
| 10 | PPCL | 96 | 102 | 6 | 6.25 |
Top Ten Losers of the week:
Joshi Hydro Power Development Company Limited (JOSHI) price has decreased by 11.67% and its LTP stands at Rs 53.
| S.N. | Symbol | Open Price (Rs.) | Closing Price (Rs.) | Change (Rs.) | Change (%) |
|---|---|---|---|---|---|
| 1 | JOSHI | 60 | 53 | -7 | -11.67 |
| 2 | NIBSF1 | 9.61 | 8.83 | -0.78 | -8.12 |
| 3 | NHPC | 55 | 51 | -4 | -7.27 |
| 4 | RRHP | 104 | 98 | -6 | -5.77 |
| 5 | KSBBL | 144 | 137 | -7 | -4.86 |
| 6 | NICGF | 9.25 | 8.8 | -0.45 | -4.86 |
| 7 | PICL | 439 | 422 | -17 | -3.87 |
| 8 | TRH | 281 | 271 | -10 | -3.56 |
| 9 | NEF | 7.8 | 7.55 | -0.25 | -3.21 |
| 10 | SIC | 464 | 450 | -14 | -3.02 |
Top Stocks by Turnover and Number of Transaction:
NMB Bank Limited (NMB) was the top traded company of the week. Total Rs 33.54 crore worth of NMB shares were traded this week.
| S.N. | Top Turnover | Top No of Transaction | ||
|---|---|---|---|---|
| Symbol | Turnover (Rs.) | Symbol | Trans (No) | |
| 1 | NMB | 335,467,447 | NMB | 3,080 |
| 2 | PRVU | 121,927,053 | RHPL | 1,487 |
| 3 | HDL | 97,782,866 | SJCL | 1,268 |
| 4 | NBL | 76,334,708 | PRVU | 1,239 |
| 5 | MBL | 73,197,002 | SABSL | 1,000 |
| 6 | CHCL | 46,960,752 | NBL | 648 |
| 7 | NABIL | 43,326,348 | HDL | 594 |
| 8 | NIB | 37,346,393 | NIB | 573 |
| 9 | NICA | 37,280,484 | UPPER | 555 |
| 10 | NCCB | 32,567,740 | CHCL | 513 |
Top Buyers Brokers of the Week:
Dynamic Money Managers Securities (Broker No- 44) was the top buyer broker of this week and it has bought stocks of worth Rs 11.81 crores.
| S.N. | Broker No. | Broker Name | Buy Amount (Rs.) |
|---|---|---|---|
| 1 | 44 | Dynamic Money Managers Securities | 118,181,290.00 |
| 2 | 58 | Naasa Securities Co. Ltd. | 113,993,634.40 |
| 3 | 34 | Vision Securities Pvt.Limited | 109,345,362.00 |
| 4 | 57 | Araya Tara Investment And Securities | 105,397,980.34 |
| 5 | 49 | Online Securities Pvt.Ltd | 99,940,274.00 |
| 6 | 6 | Agrawal Securities Pvt. Limited | 87,184,897.00 |
| 7 | 39 | Sumeru Securities Pvt.Limited | 73,098,264.00 |
| 8 | 4 | Stock Broker Opal Securities Investment | 71,206,428.00 |
| 9 | 17 | ABC Securities Pvt. Limited | 69,985,141.92 |
| 10 | 45 | Imperial Securities Co .Pvt.Limited | 63,859,033.00 |
Top Seller Broker of the Week:
Online Securities P Limited (Broker No- 49) is the top seller broker for this week. The brokerage firm has sold stocks of worth Rs 21.08 crores.
| S.N. | Broker No. | Broker Name | Sell Amount (Rs.) |
|---|---|---|---|
| 1 | 49 | Online Securities Pvt.Ltd | 210,836,136.60 |
| 2 | 34 | Vision Securities Pvt.Limited | 190,342,701.00 |
| 3 | 44 | Dynamic Money Managers Securities | 123,873,428.00 |
| 4 | 58 | Naasa Securities Co. Ltd. | 120,049,571.50 |
| 5 | 35 | Kohinoor Investment and Securities | 102,200,591.36 |
| 6 | 4 | Stock Broker Opal Securities Investment | 96,163,303.00 |
| 7 | 59 | Deevyaa Securities & Stock House | 76,235,286.00 |
| 8 | 45 | Imperial Securities Co .Pvt.Limited | 75,597,305.00 |
| 9 | 28 | Shree Krishna Securities Limited | 66,993,884.00 |
| 10 | 22 | Siprabi Securities Pvt. Limited | 58,820,083.01 |
Top 10 Market Capitalization Companies:
| S. No. | Symbol | Capitalization (Rs. In Million) |
|---|---|---|
| 1 | NTC | 93,000.00 |
| 2 | NABIL | 67,445.95 |
| 3 | NIB | 55,983.41 |
| 4 | EBL | 44,549.09 |
| 5 | SCB | 43,982.75 |
| 6 | NLIC | 43,859.36 |
| 7 | NMB | 43,813.02 |
| 8 | HBL | 41,238.04 |
| 9 | NICA | 39,453.66 |
| 10 | ADBL | 37,594.76 |
All the analysis are done with the SS Pro Software. To know more about the software click on the link below
