

Three Foreign Joint-Venture Banks in Nepal (EBL vs SBI vs SCB): A Comparative Financial Performance Review (Q4 2069/70 - Q4 2082/83)
Sat, Sep 19, 2026 11:46 AM on Financial Analysis, Highlight News, Company Analysis,
.png)
Currently, three commercial banks are operating under joint ventures with foreign banks or institutions, and all three have been operating with foreign partners since their establishment. These three banks are Everest Bank Limited (EBL), Nepal SBI Bank Limited (SBI), and Standard Chartered Bank Nepal Limited (SCB). Here is the status of these banks with their shareholding details.
These banks are considered healthier and more efficient and operate according to international practices while complying with the rules and regulations of the country in which they operate. Here, we will evaluate how these banks performed over the last fourteen years at the fourth quarter (Q4 2069/70 to Q4 2082/83).

Balance Sheet (Major Indicators)
Assets
1. Cash and Cash Equivalents
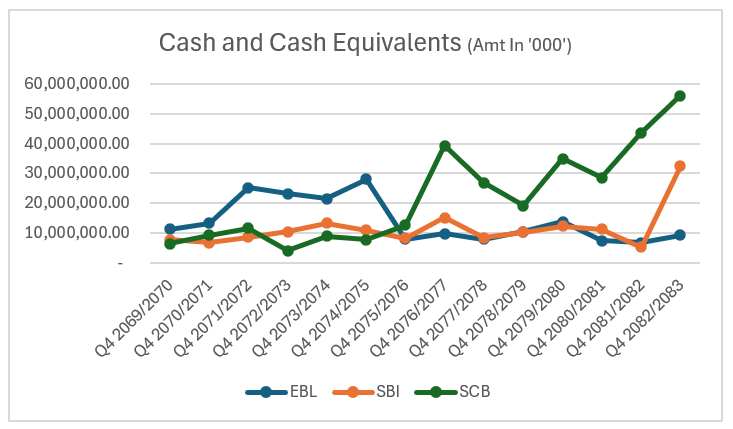
Looking at cash and cash equivalents, SCB has held the highest level of cash and cash equivalents since Q4 2075/76. In Q4 2082/83, SCB reached its highest level of cash holdings at Rs. 56.18 billion, which led to its CD ratio falling to 47.26%. The cash position of SBI sharply increased in the last year, Q4 2082/83, from Rs. 5.14 billion to Rs. 32.33 billion, an increase of 528% compared to Q4 2081/82. This was because of excess liquidity in the market and a contraction in loan demand. Meanwhile, EBL has been able to maintain its cash position at around Rs. 10 billion, which is not significantly different from previous years. This shows balanced business strategy, while its deposit growth has also been remarkable.
2. Loans and Advances to Customers
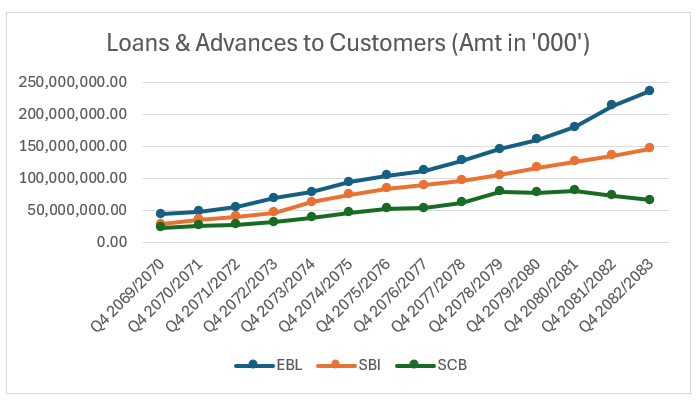
Loans and advances to customers are a core business of banks. Among the compared banks, EBL has the highest loan portfolio to customers. As of Q4 2082/83, EBL had provided loans to customers amounting to Rs. 235.56 billion, followed by SBI with Rs. 146.07 billion. Meanwhile, SCB hasn't focused on loan expansion, with Rs. 66.03 billion in its loan portfolio. The trend of loans to customers for EBL and SBI is increasing, and both reached their highest levels during the recent review period. Meanwhile, SCB peaked in Q4 2078/79, with loans to customers amounting to Rs. 79.17 billion and afterward did not appear to reach this level again, as SCB has been holding more cash and cash equivalents.
3. Total Assets
Looking at the base year taken for this study (Q4 2069/70), the total assets of EBL, SBI, and SCB were Rs. 66.54 billion, Rs. 64.79 billion, and Rs. 45.94 billion, respectively, representing relatively same range of asset sizes among the banks. After 14 years, EBL had assets of Rs. 383.75 billion, SBI have assets of Rs. 248.35 billion, and SCB stood at Rs. 180.06 billion. Compared with the base year, EBL increased its assets by 5.76 times, SBI by 3.83 times, and SCB by 3.91 times.
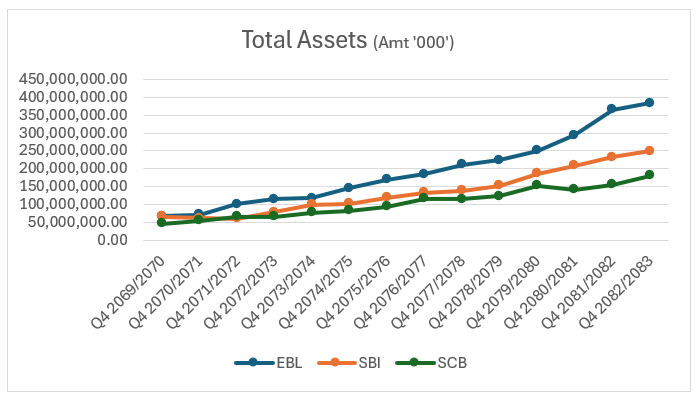
Another positive aspect of these banks is the trend in total assets. The total assets of all three banks have been increasing over the period, indicating that the banks have continuously expanded and are becoming larger asset-based institutions.
Liabilities
1. Deposits from Customers
One of the core businesses of a bank is collecting deposits from customers. Deposits are also a major liability of banks. Looking at the deposit collection of these three banks, as of Q4 2069/70, deposits from customers of EBL, SBI, and SCB were Rs. 57.72 billion, Rs. 58.92 billion, and Rs. 39.46 billion, respectively. In Q4 2082/83, deposits from customers of EBL, SBI, and SCB reached Rs. 316.01 billion, Rs. 212.82 billion, and Rs. 147.68 billion, respectively. Over the 14-year review period, EBL increased its deposits by 5.47 times, SBI by 3.61 times, and SCB by 3.71 times.
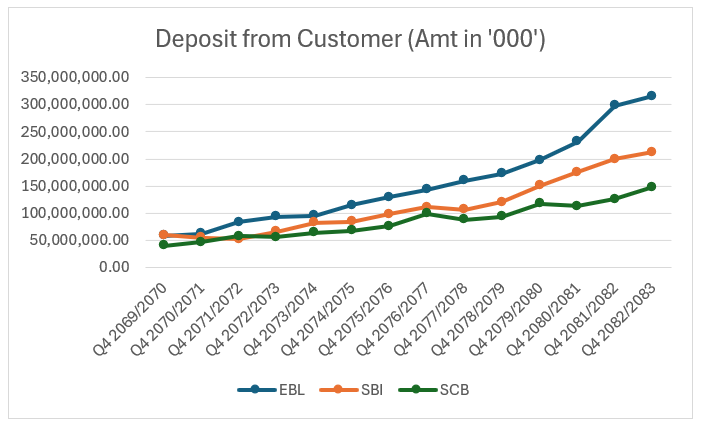
Deposits from customers of all three banks are on an increasing trend. All of them achieved historically high levels of deposits.
2. Total Liabilities (Excluding Equity)
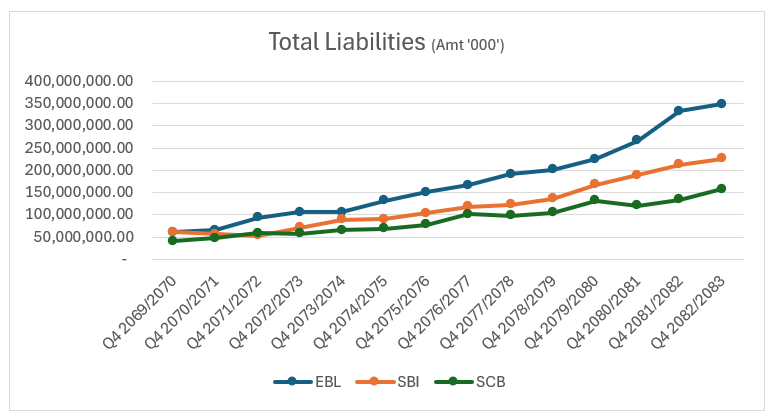
Looking at total liabilities, in the base year of the study, Q4 2069/70, EBL and SBI had similar amounts of total liabilities, amounting to Rs. 60.90 billion and Rs. 60.82 billion, respectively. At that time, SCB's total liabilities were Rs. 40.58 billion. Over the period, EBL, SBI, and SCB increased their total liabilities by 5.72 times, 3.73 times, and 3.87 times, respectively, reaching Rs. 348.56 billion, Rs. 226.28 billion, and Rs. 157.38 billion. This shows a steadily increasing trend.
3. Share Capital and Total Equity
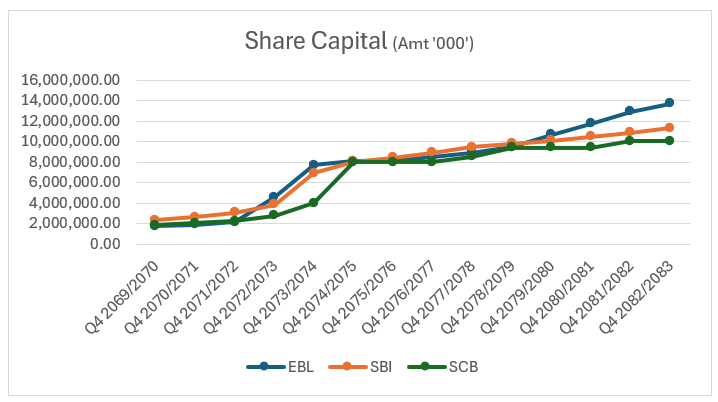
As of Q4 2082/83, the paid-up capital of EBL, SBI, and SCB stood at Rs. 13.72 billion, Rs. 11.33 billion, and Rs. 10.04 billion, respectively.
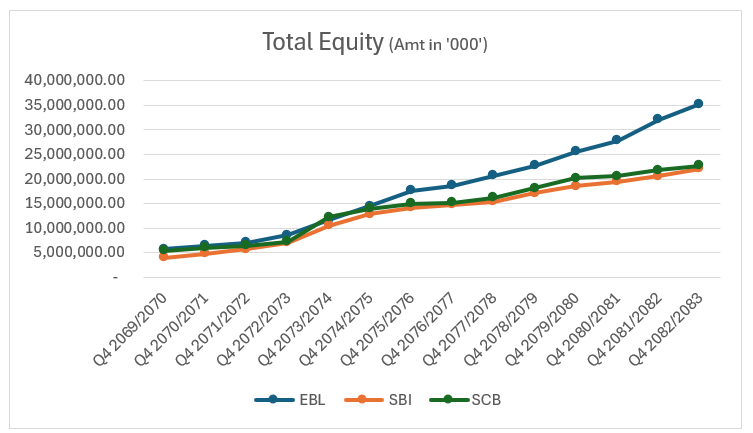
As of Q4 2082/83, the total equity of EBL, SBI, and SCB stood at Rs. 35.19 billion, Rs. 22.07 billion, and Rs. 22.67 billion, respectively. The total equity of EBL, SBI, and SCB increased by 6.24 times, 5.55 times, and 4.23 times, respectively, during the review period.
Profit and Loss
1. Interest Income
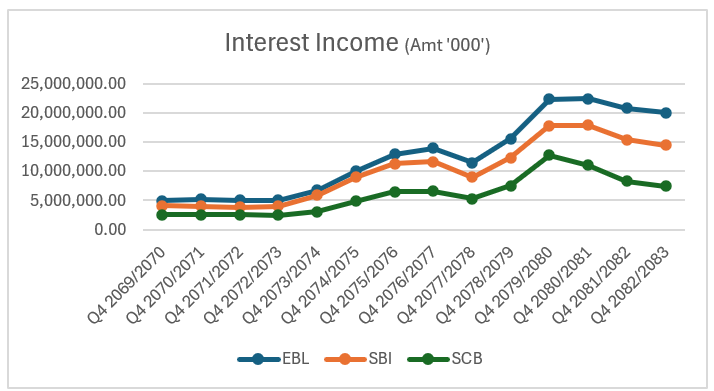
Interest income is impacted by increased competition in the market as well as policy measures taken to stabilize interest rates by NRB. As of Q4 2069/70, the interest income-to-expense margin for EBL, SBI, and SCB was 44%, 61%, and 24%, respectively. Now, it has increased to 54%, 63%, and 46%, respectively. Currently, the interest earnings of these banks are as follows. Interest income is observed to be on a declining trend.
2. Net Interest Income
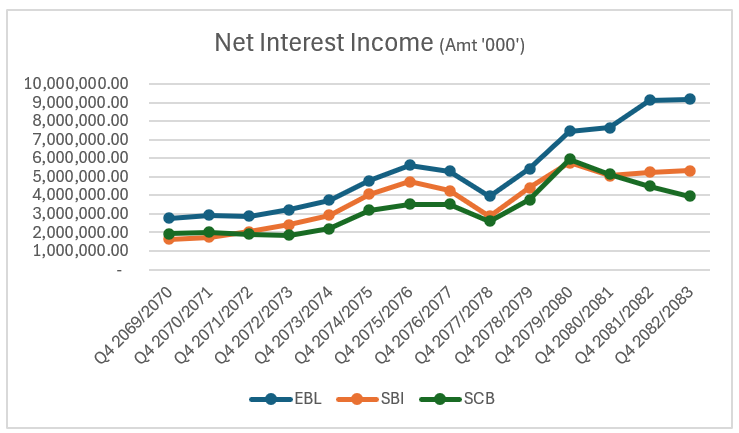
Based on Q4 2082/83, EBL earned the highest net interest income. SBI followed EBL with a wider gap, while SCB remained on its own pace. Over the overall period, EBL has been on an increasing trend and has achieved higher levels of net interest income. SCB, meanwhile, appears to be on a declining trend.
3. Total Operating Income
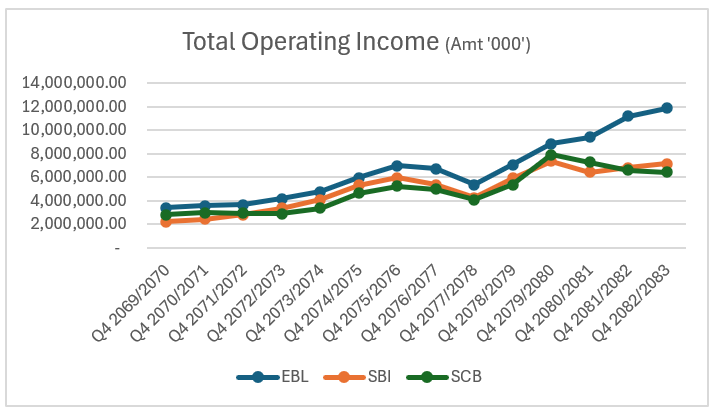
The total operating income of the three commercial banks, EBL, SBI, and SCB, from Q4 2069/70 to Q4 2079/80 shows a similar trend in earnings. All these banks showed similar trends in total operating income. Afterward, EBL continued to grow, while the total income of SBI and SCB declined.
4. Profit for the Period
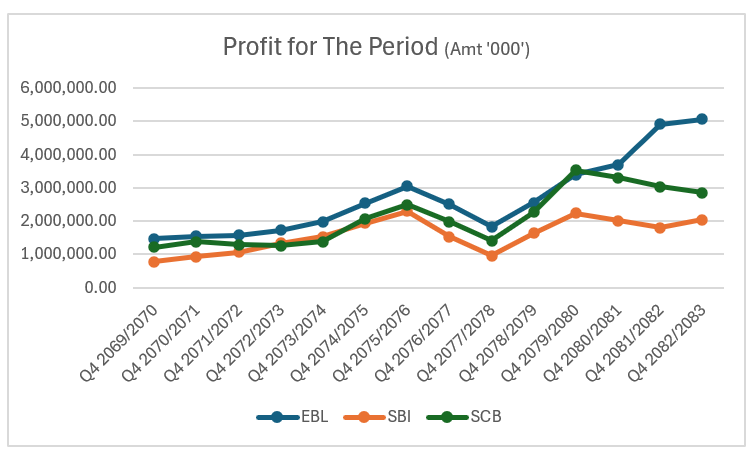
The profit for the period of the three commercial banks, EBL, SBI, and SCB, from Q4 2069/70 to Q4 2079/80 shows a similar trend in earnings. All these banks showed similar trends in profit for the period. Afterward, EBL continued to grow, while the profit of SBI and SCB declined.
Trends in Key Performance Indicators
Earnings Metrics
1. Basic Earnings per Share (EPS)
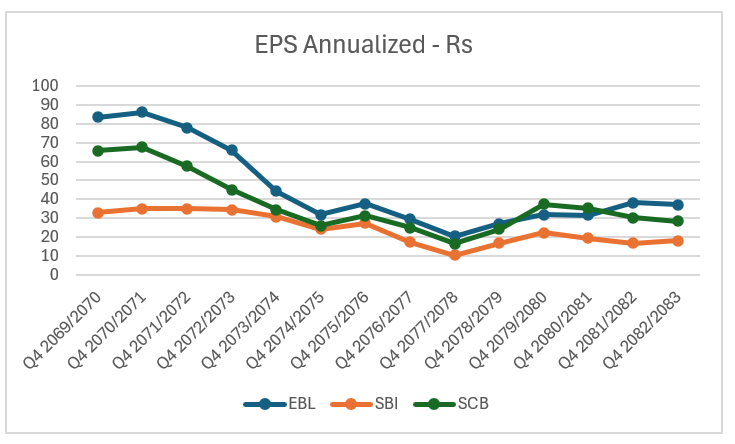
EBL recorded the highest EPS among the three banks during most of the review period, but declined from Rs. 83.53 in Q4 2069/70 to Rs. 36.95 in Q4 2082/83. SBI's EPS fell from Rs. 32.94 to Rs. 9.26, while SCB declined from Rs. 65.70 to Rs. 12.57. All three banks experienced a significant decline in per-share earnings over the long term, despite some recovery in the later years.
2. Net Worth per Share
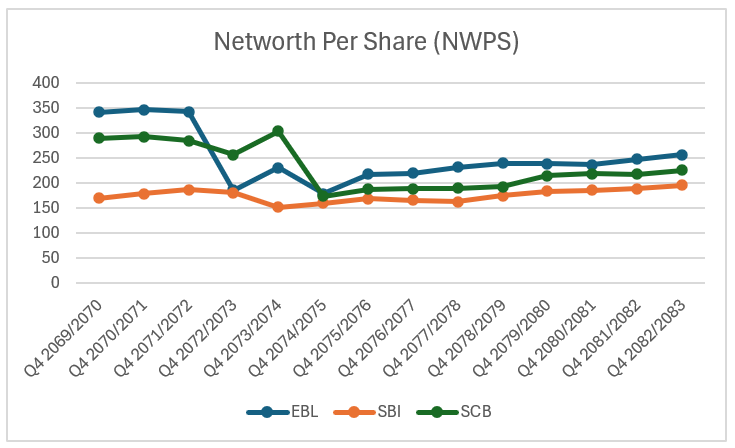
EBL's net worth per share declined from Rs. 342.06 to Rs. 256.47 over the review period, with considerable fluctuations in between. SBI increased from Rs. 168.67 to Rs. 194.73, while SCB declined from Rs. 289.07 to Rs. 225.77. The figures show different trends in shareholders' equity across the three banks.
Efficiency Measures
3. Return on Equity (ROE)
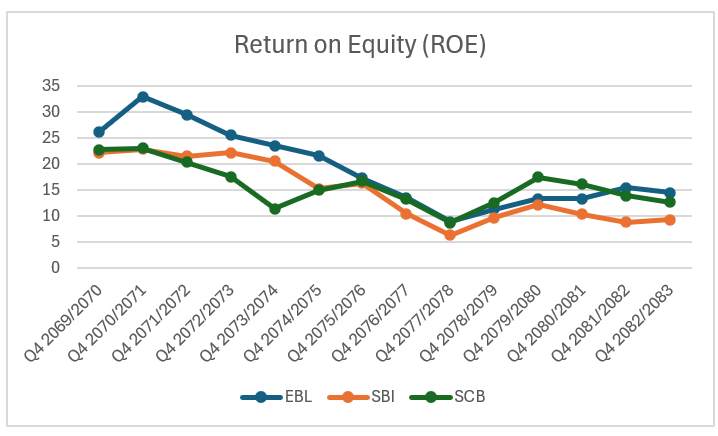
EBL's ROE declined from 26.10% to 14.41%, despite recovering from its low of 8.84%. SBI's ROE fell from 22.13% to 9.26%, while SCB declined from 22.73% to 12.57%. Overall, ROE remained lower in the later years than at the beginning of the review period.
4. Return on Assets (ROA)
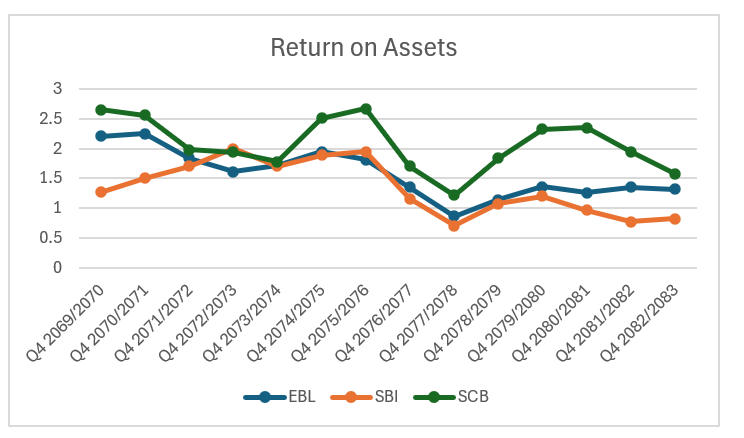
EBL's ROA decreased from 2.21% to 1.32%, while SBI declined from 1.27% to 0.82%. SCB also declined from 2.65% to 1.58%, despite recording higher ROA in several earlier years. Overall, the three banks experienced weaker asset profitability compared with the beginning of the review period.
4. Total Dividend
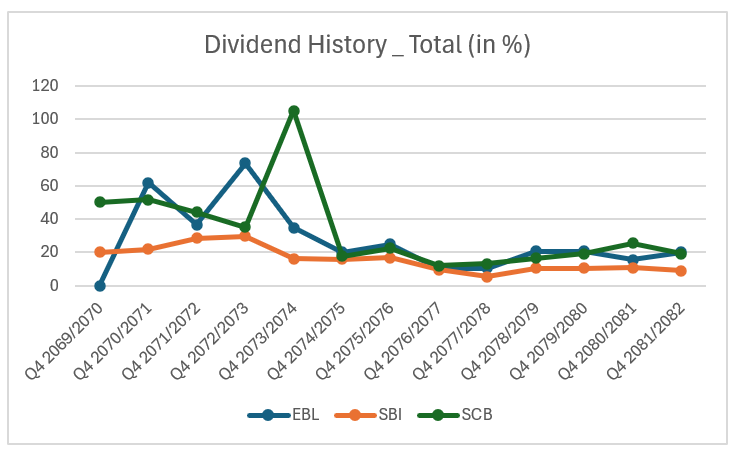
EBL's dividend declined from 60.53% to 20%, despite reaching a peak of 73.675% in Q4 2072/73. SBI's dividend decreased from 20% to 9%, while SCB declined from 50% to 19% after reaching a peak of 105.26%. Overall, dividend distribution was considerably lower in the later years compared with the earlier period.
Data Source: The data used in this article has been obtained from SS Pro by ShareSansar.

