

Weekly technical Analysis of NEPSE index; Bearish market is slowing down
Fri, Aug 31, 2018 4:30 PM on Featured, Stock Market, Technical Analysis, Weekly Analysis,
This week’s Index movement: This week stock’s were traded in Nepal Stock Exchange for 4 days and we have witnessed mix-market sentiments in the stock market. On the first trading day (Sunday) of the week the index had lost 2.78 points. On Tuesday index was up by 1.37 points and on Wednesday the index lost 4.79 points. On the last trading day (Thursday) of the week the index had gain 9.39 points and as a result of this gain index has formed bullish candle on a weekly basis.
Technical Analysis
Candlestick Pattern: On a daily and weekly candle stick, no special pattern was observed. On the monthly candlestick (August) a candle of a small body of 9 points has formed and the fluctuation of the index on the upper and lower side of the body was symmetrical. From the monthly candle-stick we can say that market was sideways, additionally, the similar kind candlestick has formed in the month of July. Monthly candle stick is opposing the current market major trend.
Exponential Moving Average (EMA): We have used three EMA’s of time period 180 days (black line), 20 days (red line) and 5 days (blue line).
.png)
The Long-term trend is bearish. The short and mid-term trend is bearish but the strength of the trend had weakened.
NEPSE index chart with Bollinger band and volume chart is shown below.
Bollinger Bands: No special pattern was observed from the Bollinger Bands.
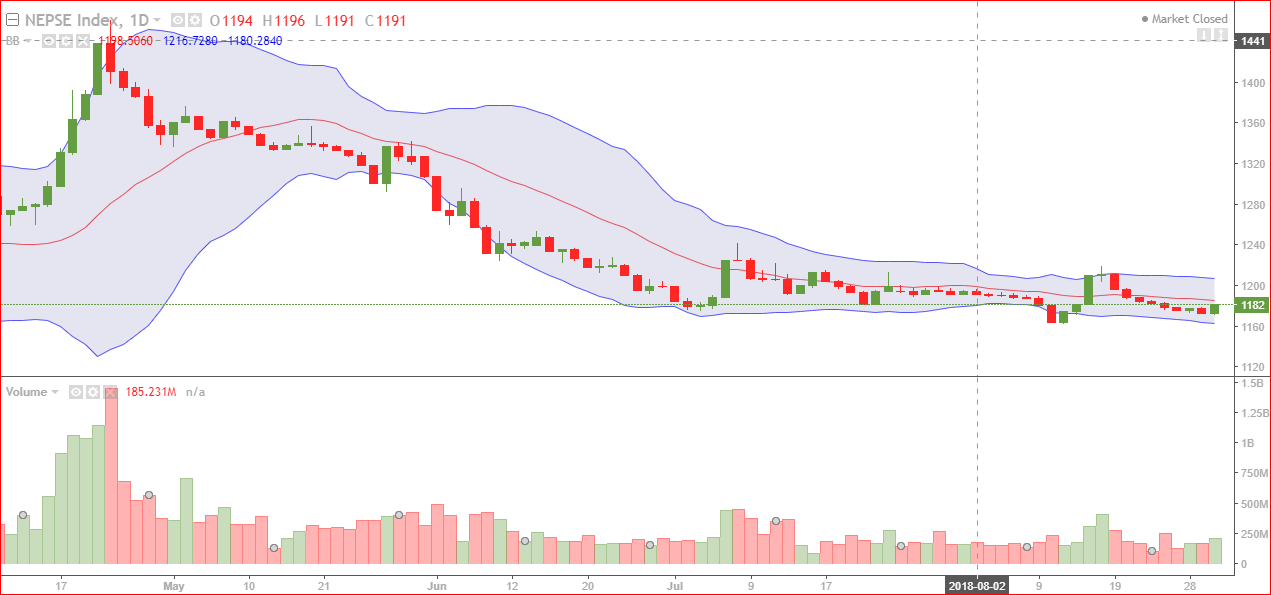
Volume: Weekly volume has decreased comparing to an average volume of last couple of weeks. On Thursday the bull candle was formed by increased volume though the increment was small. From volume chart, a strong signal was not observed.
From RSI no special pattern was observed, and it is trading at around the value of 45 points.
MACD: MACD with the NEPSE index main chart is shown below. MACD (blue line) value is around negative 5.2 points expressing negative sentiments among the investors.

Further, the signal line (red line) is above the MACD line and this crossover supports the bearish trend, however, the signal is weak.
It’s been two months we were in bearish dominating sideways market so we can expect a little retracement in upcoming months.
Predications: Low volatile sluggish short-term uptrend market for next week
Support and Resistance level according to Pivot Point
Pivot Point: 1178 points
1st Resistance: 1185 points 2nd Resistance: 1189 points
1st Support: 1174 points 2nd Support: 1167 points
This week’s market statistics:
Index Open: 1178.50 points Index Closed: 1181.69 points
High: 1182 points Low: 1171 points
Total Turnover: Rs 80.30 crore
Total Transaction: 11,788
Total Traded Shares: 25.42 Lakhs
