Stock market is a very sensitive mechanism by its nature, various catalysts – tangible and intangible information have been influencing the stock market’s performances. The tangible information represents the information available in numbers like EPS, dividend, book value, cash flow, etc. and intangibles are news, media coverage, market behavior, investor behavior, psychology, values, sentiments, over/under reactions, etc. Collectively, total returns can be classified into two parts, tangible information contributes as tangible returns and intangible information contributes as intangible returns.
These are the universal features of the stock market and have been equally affecting all stocks and every market in the world. We, Nepse, even though perform in isolation due to almost entire domestic investment/investors in comparison with other markets; the effects of news and media coverage have the same. Most of the time, the good news helps to advance the indices and bad news inversely reduce the markets indices.
If we had international investors or our companies had been investing in external economies, the market performance of Nepse would be different and challenging. On the other hand, all stakeholders including regulators must perform far better roles than what we have now. The general understanding is that if we face the challenges then we would have opportunities to handle and develop the measures to cope the challenges which is in line with the proverb “Necessity is the mother of invention” i.e. the primary driving force for new inventions is a need.
Even though the stock market operation has completed two decades in Nepal, we are just trying to upgrade from the early stage of development. Advanced technologies have given opportunities of information in our finger tips. The organized and coordinated efforts would take the benefits of the changing world so that we would feature our market with the leading capital markets in the world. The advancement is possible only if the regulators feel the need for improvements and only if they take a resinous lead. In such circumstances, we are working with hopes and waiting for major initiatives in the market. The fully automated online trading platform, if implemented successfully by next year it would be a milestone in the history of the stock market in Nepal.
Disclosure of Research Findings:
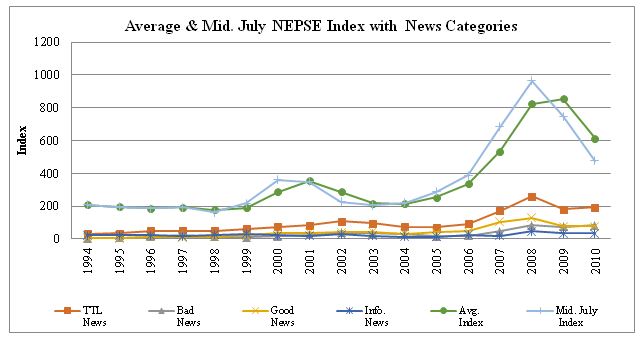
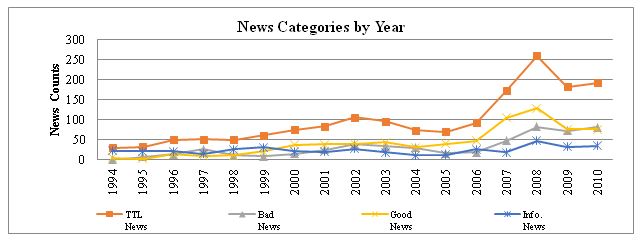
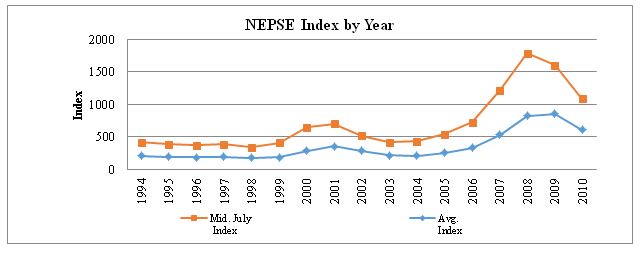
We analyze the news coverage and the market reactions for the period January 13, 1994, to July 15, 2010, total 6029 days. The movements of the stock market indices are the replications of investors and their investment behavior. Using the content analysis approach on news headings, a total of 1683 news headings related to Nepalese Stock Exchange are collected from the national daily newspaper “Kantipur” and classified them into ‘bad’ news, ‘good’ news and ‘informational’ news. There are total - 536 bad news, 734 good news, and 413 informational news during the period. The summary details are presented in the table below.
| Date |
Year |
TTL
News |
Bad
News |
Good
News |
Info.
News |
Avg.
Index |
Mid. July
Index |
| Friday, July 15, 1994 |
1994 |
30 |
1 |
6 |
23 |
209.41 |
209.41 |
| Saturday, July 15, 1995 |
1995 |
33 |
8 |
3 |
22 |
195.48 |
195.48 |
| Monday, July 15, 1996 |
1996 |
50 |
14 |
14 |
22 |
185.61 |
185.61 |
| Tuesday, July 15, 1997 |
1997 |
51 |
26 |
10 |
15 |
192.50 |
192.50 |
| Wednesday, July 15, 1998 |
1998 |
50 |
12 |
12 |
26 |
177.93 |
163.35 |
| Friday, July 16, 1999 |
1999 |
62 |
9 |
22 |
31 |
190.14 |
216.92 |
| Saturday, July 15, 2000 |
2000 |
75 |
16 |
38 |
21 |
288.81 |
360.70 |
| Sunday, July 15, 2001 |
2001 |
84 |
25 |
39 |
20 |
354.57 |
348.43 |
| Tuesday, July 16, 2002 |
2002 |
107 |
39 |
40 |
28 |
287.99 |
227.54 |
| Wednesday, July 16, 2003 |
2003 |
97 |
34 |
44 |
19 |
216.20 |
204.86 |
| Thursday, July 15, 2004 |
2004 |
74 |
30 |
32 |
12 |
213.45 |
222.04 |
| Friday, July 15, 2005 |
2005 |
70 |
17 |
40 |
13 |
254.36 |
286.67 |
| Sunday, July 16, 2006 |
2006 |
93 |
19 |
48 |
26 |
336.75 |
386.83 |
| Monday, July 16, 2007 |
2007 |
172 |
48 |
105 |
19 |
535.39 |
683.95 |
| Tuesday, July 15, 2008 |
2008 |
260 |
83 |
129 |
48 |
823.66 |
963.36 |
| Wednesday, July 15, 2009 |
2009 |
182 |
73 |
76 |
33 |
856.23 |
749.10 |
| Friday, July 16, 2010 |
2010 |
193 |
82 |
76 |
35 |
613.41 |
477.73 |
| Total |
|
1683 |
536 |
734 |
413 |
|
|
| Percent |
|
|
32% |
44% |
25% |
|
|
(The author would like to encourage interested individual/group to continue this research to date)
Consistent with the earlier studies in other countries, we find that in Nepal too, there is a negative effect of bad news, a positive effect of good news, and an inconsistent effect of informational news on stock returns. It shows the investors’ nature seems to be similar around the world. However, it also shows that the bad news seems to have a slightly stronger impact in the market in comparison with good news.
In a different analysis, it shows considerable differences in the behavior of Nepali stock market as compared to Standard & Poor’s 500 Index (S&P 500). S&P 500 is a stock market index of largest 500 US-listed companies by market capitalization. It is considered as one of the most important market indexes in the United States.
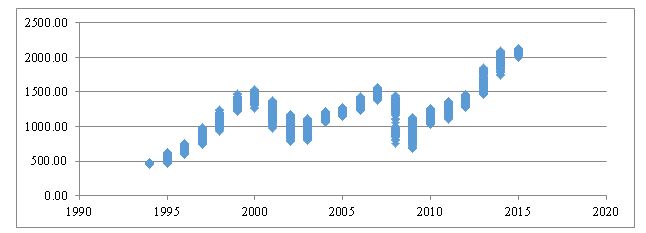
The graph below shows the spread (the range) of market indices for the period 1994 July to 2015 July. Stock indices are shown in y-axis and time (year) in x-axis. The spikes in the figure indicate the range (minimum to maximum) of the indices each year.
Yearly Spread of NEPSE
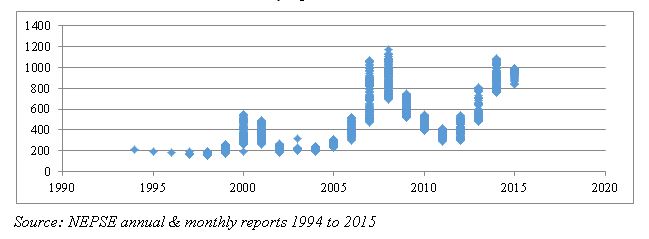 Source: NEPSE annual & monthly reports 1994 to 2015
Yearly Spread of S&P 500
Source: NEPSE annual & monthly reports 1994 to 2015
Yearly Spread of S&P 500
 Source: http://www.cboe.com/.../dailypricehistory.xls
In 2007 followed by 2008 are the largest index spreads in Nepse with upward slopping whereas S&P 500 index in 2008 has the largest index spread but it is a downward slopping corresponding to the financial crisis in the USA which was continued till 2009. The Nepalese financial market swung upward and reached its highest level of the period in 2008 while S&P 500 index was diving into historic fall. By this comparison, it can be seen that the behavior of the Nepalese stock market can be considered quite different from the S&P 500. It also shows that the bull sentiments in Nepse have short lives than S&P 500 which is continuously maintaining its bull sentiments after 2009. Thus, it would appear that the Nepse can be analyzed by completely isolating from the other financial markets in the world.
The differences in behavior of the Nepalese stock market as compared to the S&P 500 can be of considerable interest to the investors who look for dissimilar financial markets, especially if the market index exhibit different return patterns, around the world since the same would help in risk reduction through global diversification. Also, it would be a great opportunity for Non-Resident Nepalese living in around the globe.
(*The author is a Gold medalist from TU for the courses of M. Phil in Management with specialization in Finance in 2012. Now, he is working as a Assistant Manager - Finance in a consulting firm in New York. The opinion presented in the article is personal. You can reach to the author at su.kadariya@gmail.com)
Graphical Presentation on News Counts