

Non-Life Insurance and Microfinance sector witness a massive rallies with weekly recording breaking turnover of Rs 11.20 arba ; Kalika Laghubitta gains 32.76% ; Shivam Cements traded most (Weekly Wrap up)
Sat, Feb 22, 2020 12:11 PM on NEPSE News, Weekly Analysis, Featured,
NEPSE Index gained 89.98 points (6.69%) in the trading week between 16th February to 20th February, 2020. This week market opened at 1344.59 points but close at high of the week 1434.57 points on Thursday.

This week's market statistics:
Index Open- 1344.59 points Index Close- 1434.57 points
Index High- 1434.57 points Index Low- 1344.74 points
Candlestick pattern:
This week, 5 green and no red candles were formed. Bullish Marabozu candlestick was formed on last trading day.
Exponential Moving Average:
We have used EMA's of 5 days' time period (blue line), 20 days' time period (red line). At present, NEPSE Index is above both 5 days EMA and 20 days EMA. Values above moving average signals for bullishness. Golden cross signal was generated by moving average on 5th of December,2019.
Moving Average Convergence and Divergence:
MACD line (blue) and the signal line (red line) are in Positive zone. Signal line have crossed the MACD line, this indicates a bullish signal. Histogram is also in positive zone. Overall MACD is indicating upward momentum.
Fibonacci retracement:
A Fibonacci retracement refers to areas of support or resistance. The indicator is useful because it can be drawn between any two significant price points, such as a high and a low, and then the indicator will create the levels between those two points.
The Fibonacci retracement levels are
61.8% - 1254
78.6% - 1295
100% - 1348
161.8% - 1500
261.8% - 1745
Turnover
Average Turnover of this week: Rs 2.24 arba
Support and resistance level for next trading week according to Pivot Point.
Pivot Point- 1404 point
1st Resistance- 1464 point 1st Support- 1374 point
2nd Resistance- 1494 point 2nd Support- 1314 point
3rd Resistance- 1554 point 3rd Support- 1284 point
Conclusion: NEPSE is in bullish trend and have a strong resistance at 1500.
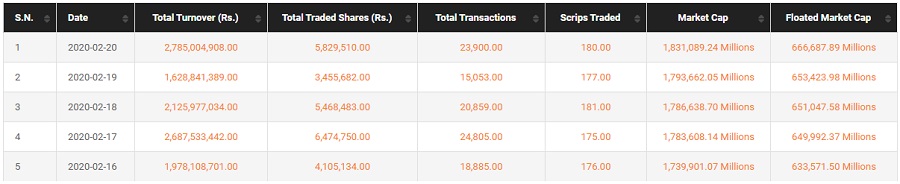
Weekly Market Summary of NEPSE
More than 2.53 crore unit shares of worth Rs 11.205 arba has been traded through 1.03 lakhs transactions this week. The current market capitalization of NEPSE stands at Rs. 1,831,089.24 Million.

NEPSE index and Sub-indices performance: (Increment here is based on the previous week closed value)
The NEPSE index increased by 6.69%. All the indices increased this week. The top gainer sector of this week is non-life insurance sector with the rise of massive 14.66% followed by microfinance sector with rise of 13.52%.


All the analysis are done with the SS Pro Software. To know more about the software click on the link below
Stock with the highest monthly Beta value from the Banking, Insurance & Finance Sector
Summit Laghubitta Bittiya Sanstha Limited (SMFDB) has the highest monthly Beta value of 2.44 followed by Naya Nepal Laghubitta Bikas Bank Limited (NNLB) with 2.22 beta value.

Top Ten Gainers of the week:
Kalika Laghubitta Bittiya Sanstha Limited (KMCDB) is the top gainer of the week. KMCDB closed at Rs 928 with Rs 229 (32.76%) increment.

Top Ten Losers of the week:
Bank of Kathmandu Limited Promoter Share (BOKLPO) price has decreased by 20.67% and its LTP stands at Rs 160.

Top Stocks by Turnover, Volume and Number of Transaction:
Shivam Cements Limited (SHIVM) is the top traded company of the week. Total Rs 65.30 crore worth of SHIVM shares were traded this week.

Top Buyers Brokers of the Week:
Naasa Securities (Broker No- 58) was the top buyer broker of this week and it has bought stocks of worth Rs 68.66 crores.

Top Buyer Brokers Top 10 Bought Companies:

Top Seller Broker of the Week:
Vision Securities (Broker No- 34) is the top seller broker for this week. The brokerage firm has sold stocks of worth Rs 34.43 crores.

Top Seller Brokers Top 10 Sold Companies:

Top Companies with Highest Market Capitalizations:

All the analysis are done with the SS Pro Software. To know more about the software click on the link below
