

Find out which companies is Overvalued and Undervalued as per Price to Earnings ratio (Exclusive Study)
Fri, May 20, 2016 3:00 PM on Latest, Exclusive, Financial Analysis, Featured, Stock Market,

Price-earnings ratio (P/E Ratio) is the ratio for valuing a company that measures its current share price relative to its per-share earnings. It shows the amount Investor is willing to pay for Rupee 1 of current earning.
P/E ratio indicates the expectations of the investor regarding the earning of the company. The Investor’s expectations are reflected in the market price of the share and therefore the P/E ratio gives an idea of investor’s perception of the EPS. The P/E ratio is one of the most widely used measures of financial analysis in practices.
Generally high P/E stock indicates high risk and vice versa. High expectation from a stock results in higher price of the scrip that makes it overvalued and riskier.
How to calculate the price to earnings ratio:
Price / Earnings ratio = Price per share /Earning per share
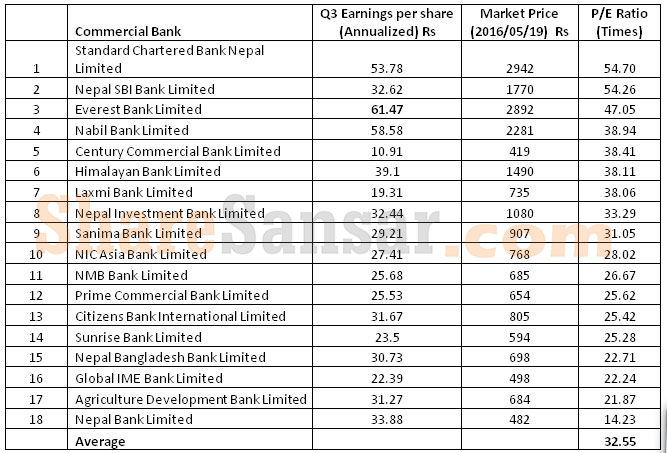
For Example last date price of Everest Bank at Rs 2,915 and the company Q3 earning per share (EPS) is Rs 61.47 annualized.
P/E ratio =2,915/61.47 = Price earning per share of Everest bank is 47.42 times
Why P/E Ratio Difference among Companies
Stock Prices reflect market expectation about the earning per share of the company. Companies having higher earnings growth rate will tend to be higher price resulting high PE and vice versa.
Now calculate the price earnings ratio of commercial bank who has published third quarter of FY 2072/73:
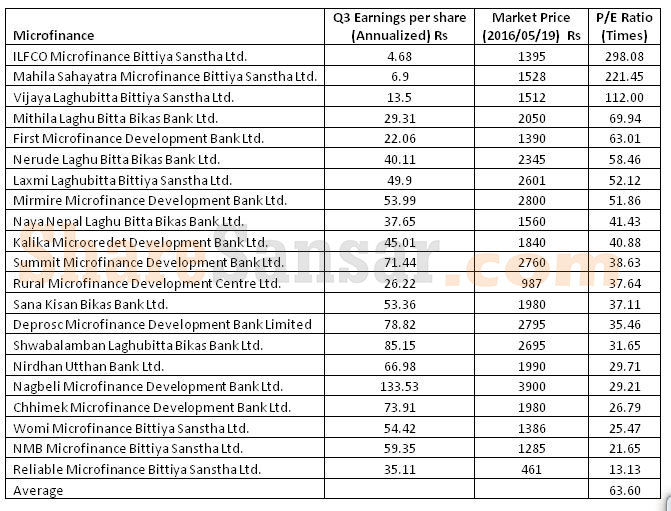
 Now calculate the price earnings ratio of Microfinance who has published third quarter:
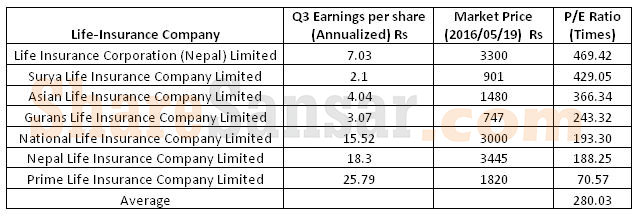
 Now calculate the price earnings ratio of Life Insurance who has published third quarter report:
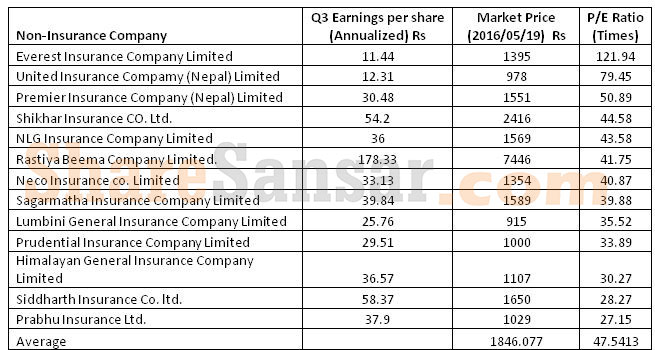
 Now calculate the price earnings ratio of Non- Insurance who has published third quarter report:
Now calculate the price earnings ratio of Microfinance who has published third quarter:
Now calculate the price earnings ratio of Life Insurance who has published third quarter report:
Now calculate the price earnings ratio of Non- Insurance who has published third quarter report:
