

All major technical indicators are supporting end of short term down trend; Hotel and Life Insurance sector lost the most; Weekly Wrap Up of NEPSE
Sun, Sep 8, 2019 6:49 AM on NEPSE News, Weekly Analysis, Latest,
This week NEPSE made volatility of 41.76 points. NEPSE made a high of 1198.48 and low of 1156.72 within a week. Index opened at 1196.41 points and closed at 1191.07 points with the loss of 5.34 points (0.44%). On Sunday the index was down by 11.63 points to 1184.78. The market slipped down further on Monday by 14.44 points. Market made a low of 1156.72 but closed on 1190.90 on Tuesday. Tuesday was most volatile day of a week. Wednesday index gained 3.87 and on Thursday index fell by 3.70 points.

Candlestick pattern:
First 3 trading days, long candles were made whereas, Small sized candlestick were formed in last 2 trading days.
Exponential Moving Average:
We have used EMA's of 5 days' time period (blue line), 20 days' time period (red line). At present, NEPSE Index is below 20 days EMA but above 5 days EMA. Values above short term EMA indicates possibility of start of short term up trend. Starting of uptrend will be confirm after Nepse Index closes above 20 days EMA.
Relative Strength Index:
Relative Strength Index is currently at over sold zone, 36.
Moving Average Convergence and Divergence:
MACD line (blue) and the signal line (red line) are in negative zone but into a verse of crossover. Cross over of signal line by MACD line indicates early entry of buyers.
Fibonacci retracement method:
NEPSE Index is trading between 61.8% and 78.6 % Fibonacci level. Index trading above 61.8% level could lead index to 1224.
This week's market statistics:
Index Open-1194.09 points Index closed-1191.07 points
Index High- 1198.48 points Index low- 1156.72 points
Support and resistance level for next week according to Pivot Point.
Pivot Point- 1181 point
1st Resistance-1207 point 1st support-1165 point
2nd Resistance-1223 point 2nd support-1139 point
Conclusion: All major indicators are supporting end of short term down trend. We can aspect market won’t go below 1156 next week.
Prediction: Low volatile range trading between 1170 – 1224.
Weekly Market Summary of NEPSE
More than 70.49 lakhs unit shares of worth Rs 1.94 arba has been traded through 37.49 thousand transactions this week compared to 60.24 lakhs unit of shares of worth Rs 1.62 arba, last week. The current market capitalization of NEPSE stands at Rs. 1,512,669.69 Million.
| This week | Last week | Percentage Change | |
|---|---|---|---|
| Total Turnover (Rs.) | 1,942,141,801.00 | 1,624,838,377.00 | 19.53% |
| Total Traded Shares | 7,049,319.00 | 6,024,975.00 | 17.00% |
| Total No. of Transactions | 37,490.00 | 29,600.00 | 26.66% |
| Market Cap at (In million Rs) | 1,512,669.69 | 1,519,459.38 | -0.45% |
| Floated Market Cap at (In million Rs) | 545,401.00 | 546,197.59 | -0.15% |
| No of trading days | 5 | 5 | 0 |
The turnover has increased by 19.53% this week compared to last week and the total number of transaction also increased by 26.66%.
Sector-wise breakdown of the turnover of this week:
The commercial bank sector made 45% of the total turnover this week followed by microfinance sector with 13% of the total turnover.

| Sector | This Week (Sept 1-5) | This Week (Aug 25-29) | ||
|---|---|---|---|---|
| Turnover (Rs in Millions) | Weightage | Turnover (Rs in Millions) | Weightage | |
| Commercial Banks | 882.19 | 45.42% | 697.94 | 42.95% |
| Microfinance | 245.14 | 12.62% | 162.74 | 10.02% |
| Life Insurance | 154.66 | 7.96% | 87.17 | 5.36% |
| Hydro Power | 146.47 | 7.54% | 130.55 | 8.03% |
| Promotor Shares | 142.53 | 7.34% | 291.26 | 17.93% |
| Others | 82.06 | 4.23% | 45.24 | 2.78% |
| Development Banks | 79.04 | 4.07% | 86.26 | 5.31% |
| Manu. And Processing | 75.16 | 3.87% | 40.61 | 2.50% |
| Non Life Insurance | 74.76 | 3.85% | 46.84 | 2.88% |
| Finance | 41.58 | 2.14% | 16.22 | 1.00% |
| Hotels | 14.88 | 0.77% | 15.11 | 0.93% |
| Mutual Fund | 3.33 | 0.17% | 4.84 | 0.30% |
| Preference Shares | 0.33 | 0.02% | 0.01 | 0.00% |
| Tradings | 0 | 0.00% | 0.05 | 0.00% |
NEPSE index and Sub-indices performance: (Increment here is based on the previous week closed value)
The NEPSE index declined by 0.45%. Majority of the indices end the week with the loss. Top loser sector of this week is Hotel Sector with the decline of 2.12%.
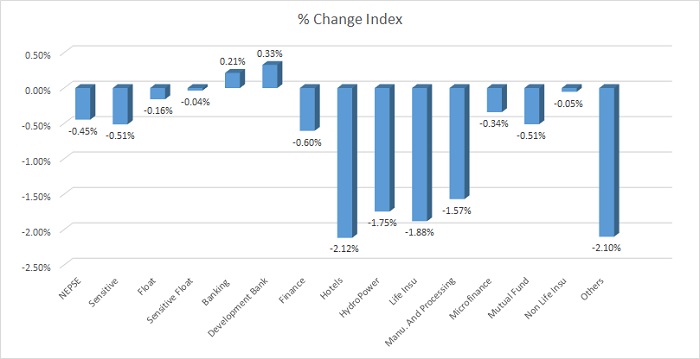
Top gainer of the week is Development Bank sector which rises by 0.33%.
| Index | This Week | Last Week | Point Change | % Change Index |
|---|---|---|---|---|
| NEPSE | 1,191.07 | 1,196.41 | -5.34 | -0.45% |
| Sensitive | 259.9 | 261.24 | -1.34 | -0.51% |
| Float | 87.92 | 88.06 | -0.14 | -0.16% |
| Sensitive Float | 83.31 | 83.34 | -0.03 | -0.04% |
| Banking | 1,090.24 | 1,087.92 | 2.32 | 0.21% |
| Development Bank | 1,589.08 | 1,583.90 | 5.18 | 0.33% |
| Finance | 577.17 | 580.68 | -3.51 | -0.60% |
| Hotels | 1,958.89 | 2,001.26 | -42.37 | -2.12% |
| HydroPower | 996.86 | 1,014.57 | -17.71 | -1.75% |
| Life Insurance | 5,388.43 | 5,491.79 | -103.36 | -1.88% |
| Manu. And Processing | 2,476.03 | 2,515.51 | -39.48 | -1.57% |
| Microfinance | 1,505.59 | 1,510.74 | -5.15 | -0.34% |
| Mutual Fund | 9.73 | 9.78 | -0.05 | -0.51% |
| Non Life Insurance | 4,636.14 | 4,638.62 | -2.48 | -0.05% |
| Others | 671.48 | 685.89 | -14.41 | -2.10% |
Stock with the highest monthly Beta value from the Banking &Finance Sector
The table below shows the list:
| SN | Stock Symbol | LTP | Monthly Beta | Sector |
|---|---|---|---|---|
| 1 | MSMBS | 482 | 3.72 | Microfinance |
| 2 | NNLB | 444 | 3.03 | Microfinance |
| 3 | CLBSL | 521 | 2.45 | Microfinance |
| 4 | GLBSL | 478 | 2.45 | Microfinance |
| 5 | GILB | 748 | 2.39 | Microfinance |
| 6 | LLBS | 707 | 2.31 | Microfinance |
| 7 | ILBS | 448 | 2.21 | Microfinance |
| 8 | MLBBL | 451 | 2.20 | Microfinance |
| 9 | NLBBL | 521 | 2.15 | Microfinance |
| 10 | RSDC | 349 | 2.14 | Microfinance |
Mahila Sahayatra Laghubitta (MSMBS) has the highest monthly Beta value of 3.72 followed by the Naya Nepal Laghubitta (NNLB) with 3.03 beta value.

All the companies of the top ten beta value belong to the microfinance sector.
All the analysis are done with the SS Pro Software. To know more about the software click on the link below
Top Ten Gainers of the week:
Sabaiko Laghubitta Bittiya Sanstha Limited (SABSL) is the top gainer of the week. SABSL closed at Rs 485 with Rs 44 (9.98%) increment.
| S.N. | Symbol | Open Price (Rs.) | Closing Price (Rs.) | Change (Rs.) | Change (%) |
|---|---|---|---|---|---|
| 1 | SABSL | 441 | 485 | 44 | 9.98 |
| 2 | UFL | 175 | 192 | 17 | 9.71 |
| 3 | GBLBS | 347 | 364 | 17 | 4.9 |
| 4 | AKBSL | 318 | 330 | 12 | 3.77 |
| 5 | KRBL | 104 | 107 | 3 | 2.88 |
| 6 | GHL | 73 | 75 | 2 | 2.74 |
| 7 | AKPL | 151 | 155 | 4 | 2.65 |
| 8 | KPCL | 82 | 84 | 2 | 2.44 |
| 9 | WMBF | 89 | 91 | 2 | 2.25 |
| 10 | RRHP | 101 | 103 | 2 | 1.98 |
Top Ten Losers of the week:
NIC Asia Growth Fund (NICGF) price has decreased by 11.92% (NICGF Price has adjusted for 10% cash dividend this week).
| S.N. | Symbol | Open Price (Rs.) | Closing Price (Rs.) | Change (Rs.) | Change (%) |
|---|---|---|---|---|---|
| 1 | NICGF | 9.65 | 8.5 | -1.15 | -11.92 |
| 2 | SJCL | 203 | 190 | -13 | -6.4 |
| 3 | RHPL | 185 | 174 | -11 | -5.95 |
| 4 | OHL | 580 | 548 | -32 | -5.52 |
| 5 | HPPL | 148 | 140 | -8 | -5.41 |
| 6 | NLG | 642 | 611 | -31 | -4.83 |
| 7 | GLICL | 420 | 400 | -20 | -4.76 |
| 8 | NLBBL | 548 | 522 | -26 | -4.74 |
| 9 | ALICL | 326 | 313 | -13 | -3.99 |
| 10 | SPDL | 78 | 75 | -3 | -3.85 |
Top Stocks by Turnover and Number of Transaction:
Nepal Life Insurance (NLIC) was the top traded company of the week. More than Rs 19.70 crore worth of NLIC shares were traded this week.
| S.N. | Top Turnover | Top No of Transaction | ||
|---|---|---|---|---|
| Symbol | Turnover (Rs.) | Symbol | Trans (No) | |
| 1 | NLIC | 19,703,205 | RHPL | 776 |
| 2 | SHIVM | 11,967,460 | SJCL | 755 |
| 3 | PRVU | 10,514,031 | SABSL | 303 |
| 4 | NLICP | 10,300,000 | NLIC | 272 |
| 5 | KBL | 9,351,010 | UPPER | 185 |
| 6 | NBL | 9,151,061 | PRVU | 147 |
| 7 | SANIMA | 9,044,866 | SHIVM | 131 |
| 8 | CZBIL | 7,989,849 | KBL | 124 |
| 9 | NIB | 7,706,231 | NIB | 119 |
| 10 | ADBL | 7,593,805 | CCBL | 112 |
Top Buyers Brokers of the Week:
Vision Securities Pvt. Limited (Broker No- 34) was the top Buyer broker of this week and it has bought stocks of worth Rs 21 crores.
| S.N. | Broker No. | Broker Name | Buy Amount (Rs.) |
|---|---|---|---|
| 1 | 34 | Vision Securities Pvt.Limited | 210,004,435.40 |
| 2 | 49 | Online Securities Pvt.Ltd | 166,464,436.00 |
| 3 | 44 | Dynamic Money Managers Securities Pvt.Ltd | 110,446,242.00 |
| 4 | 38 | Dipshika Dhitopatra Karobar Co. Pvt.Limited | 77,815,946.00 |
| 5 | 45 | Imperial Securities Co .Pvt.Limited | 69,870,481.23 |
| 6 | 25 | Sweta Securities Pvt. Limited | 62,097,833.00 |
| 7 | 57 | Araya Tara Investment And Securities Pvt. Ltd. | 56,621,840.00 |
| 8 | 32 | Premier Securites Company Limited | 55,671,282.00 |
| 9 | 39 | Sumeru Securities Pvt.Limited | 51,324,430.00 |
| 10 | 4 | Opal Securities Investment Pvt. Limited | 50,434,156.00 |
Top Seller Broker of the Week:
Online Securities Investment Pvt. Limited. (Broker No- 49) is the top seller broker for this week. The brokerage firm has sold stocks of worth Rs 15.26 crores.
| S.N. | Broker No. | Broker Name | Sell Amount (Rs.) |
|---|---|---|---|
| 1 | 49 | Online Securities Pvt.Ltd | 152,641,076.59 |
| 2 | 45 | Imperial Securities Co .Pvt.Limited | 133,501,782.00 |
| 3 | 4 | Opal Securities Investment Pvt. Limited | 93,687,978.00 |
| 4 | 32 | Premier Securites Company Limited | 93,502,262.10 |
| 5 | 38 | Dipshika Dhitopatra Karobar Co. Pvt.Limited | 80,154,224.00 |
| 6 | 25 | Sweta Securities Pvt. Limited | 69,069,061.00 |
| 7 | 28 | Shree Krishna Securities Limited | 66,336,934.00 |
| 8 | 43 | South Asian Bulls Pvt.Limited | 64,256,649.00 |
| 9 | 58 | Naasa Securities Co. Ltd. | 62,135,795.00 |
| 10 | 34 | Vision Securities Pvt.Limited | 60,823,326.90 |
Top 10 Market Capitalization Companies:
| S.N. | Symbol | Capitalization (Rs. In Million) |
|---|---|---|
| 1 | NTC | 97650 |
| 2 | NABIL | 70237.44 |
| 3 | NIB | 58814.75 |
| 4 | EBL | 49927.09 |
| 5 | SCB | 49831.1 |
| 6 | HBL | 45583.37 |
| 7 | NLIC | 44408.98 |
| 8 | NICA | 39665.69 |
| 9 | ADBL | 38316 |
| 10 | SBI | 37514.67 |
All the analysis are done with the SS Pro Software. To know more about the software click on the link below
