


Seasonality of the Nepalese Stock Market: A Historical Analysis of NEPSE and Sectoral Indices

.png)
Seasonality does not guarantee future performance, but it provides valuable insights into recurring historical market behavior. The analysis below is based on the monthly performance history of each NEPSE index and Sub-Indices, measuring both the probability of a positive monthly close (close > open) and the average monthly return. These statistics help identify periods when certain sectors have historically exhibited stronger momentum.
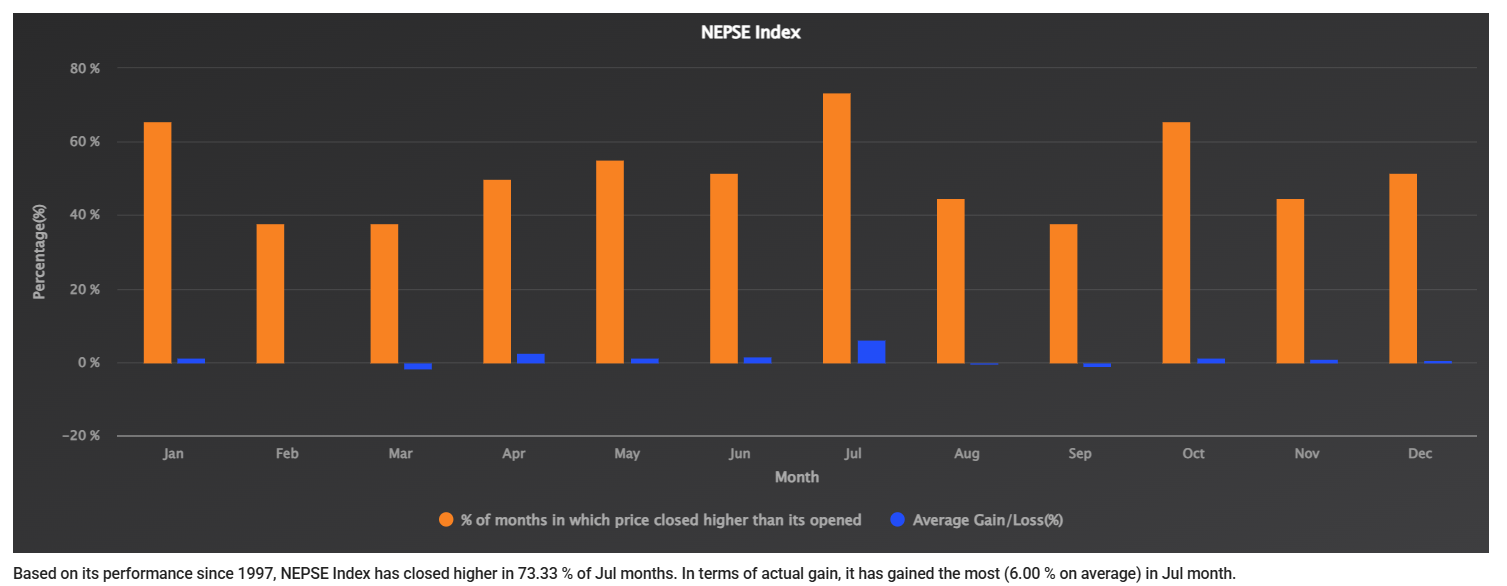
NEPSE Index
Historically, July (Shrawan) has been the strongest month for the NEPSE Index. Since 1997, the index has closed higher in 73.33% of all July observations while delivering an average monthly gain of 6.00%, making it the highest-returning month of the year. This is because listed companies published own performance report and investor analyze report and invest on best performed companies with expectation of getting higher dividends. The publication of fourth-quarter financial results driven dividend expectations, and portfolio repositioning by investors.
The remaining months show comparatively modest performance. January and October also record relatively high winning probabilities of 65.52%, but their average gains remain close to only 1%. Meanwhile, February, March, August, and September have historically been weaker months, with March and September posting negative average returns. Overall, the seasonal pattern suggests that market sentiment strengthens significantly around July before moderating during the following months.
Banking Index
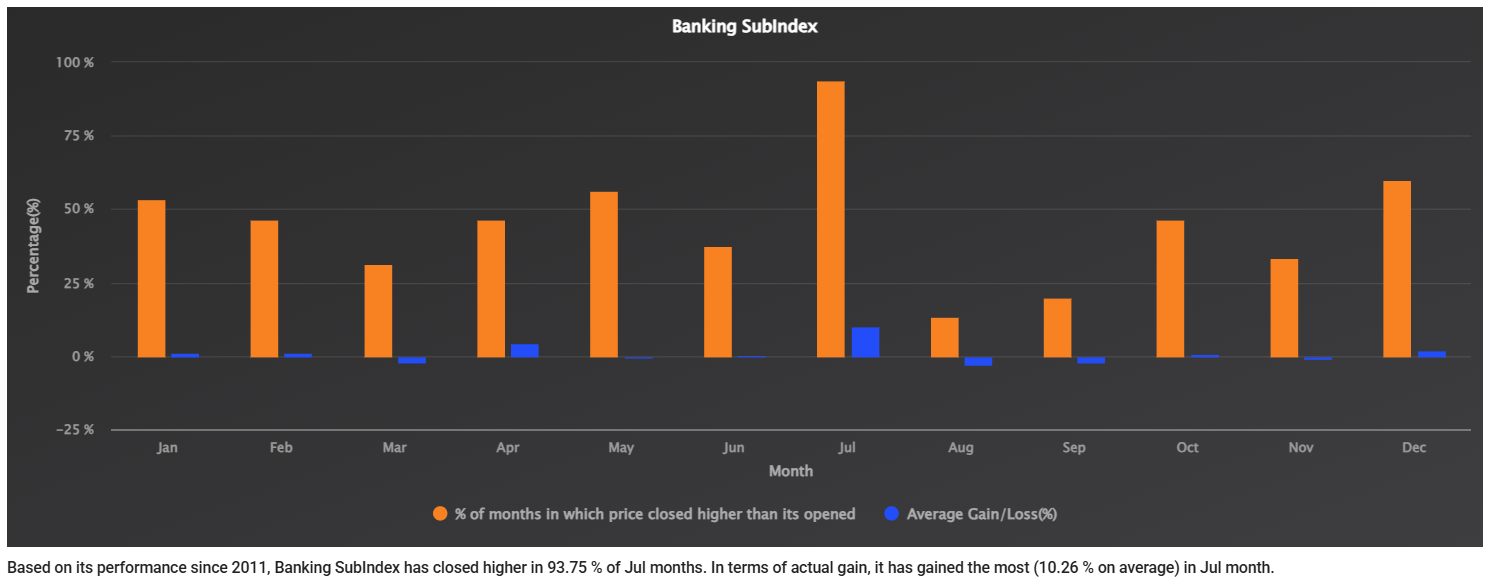
Among all sectoral indices, the Banking Index exhibits one of the strongest July seasonal effects. Since 2011, the index has finished higher in 93.75% of Julys and generated an impressive average monthly return of 10.26%, the highest average gain across all months. This remarkable consistency reflects investors' focus on commercial banks during the dividend announcement season, as banks generally maintain predictable earnings and dividend policies.
Outside July, the Banking Index shows mixed performance. April produces the second-highest average gain at 4.49%, this is because month of April falls in Chaitra month in Nepalese month. In this month Banks published Third-quarter report investor analyze and predict for fourth quarter and take decision accordingly. While December also performs relatively well. However, August and September have historically been weak, recording both low winning frequencies and negative average returns. This pattern indicates that investors often accumulate banking stocks before or during the dividend expectation period and gradually take profits afterward.
Development Bank Index
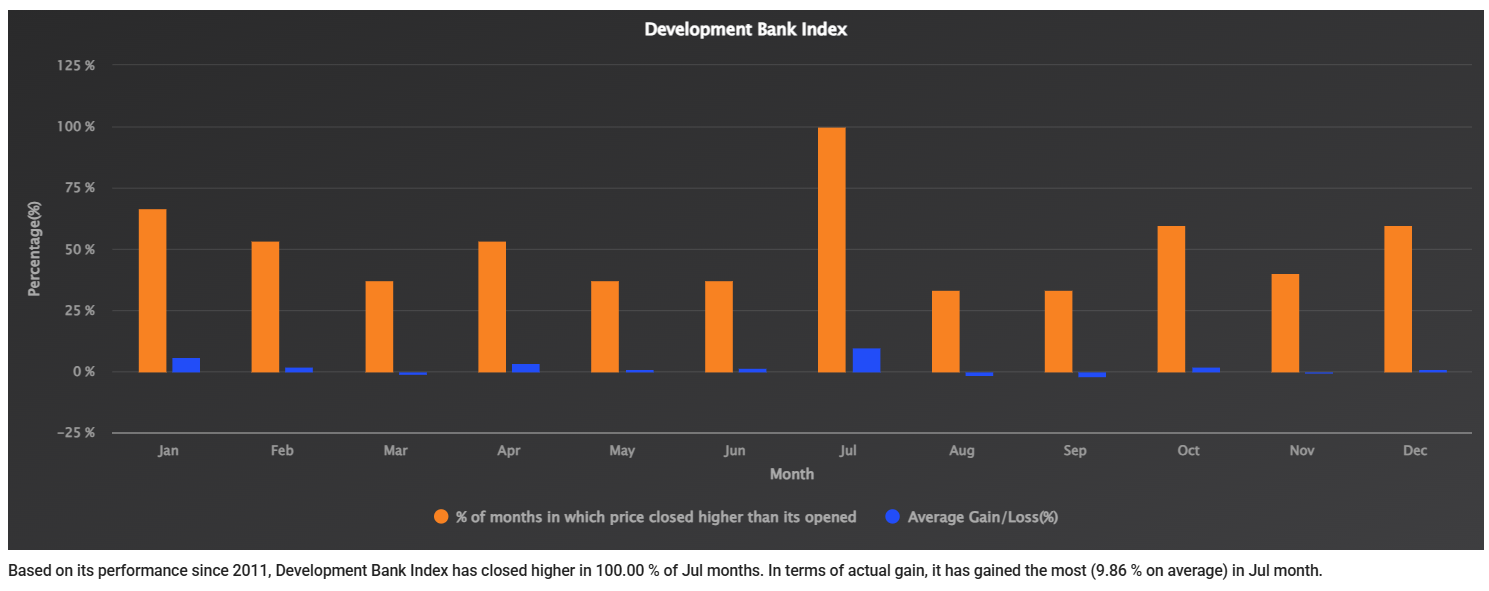
The Development Bank Index has recorded a perfect July winning record since 2011, closing higher in 100% of observed Julys while generating an average monthly gain of 9.86%. This exceptional consistency highlights the sector's strong sensitivity to fiscal year-end financial disclosures and dividend speculation. Investors historically appear willing to reprice development bank stocks aggressively once annual earnings become clearer.
Apart from July, January has also delivered strong average returns of 5.88%, suggesting that positive momentum occasionally extends into the calendar year's beginning. Conversely, August and September have produced consecutive negative average returns, indicating that much of the seasonal optimism tends to fade after the dividend expectation period. Overall, development banks demonstrate one of the clearest seasonal cycles within the Nepalese equity market.
Finance Index
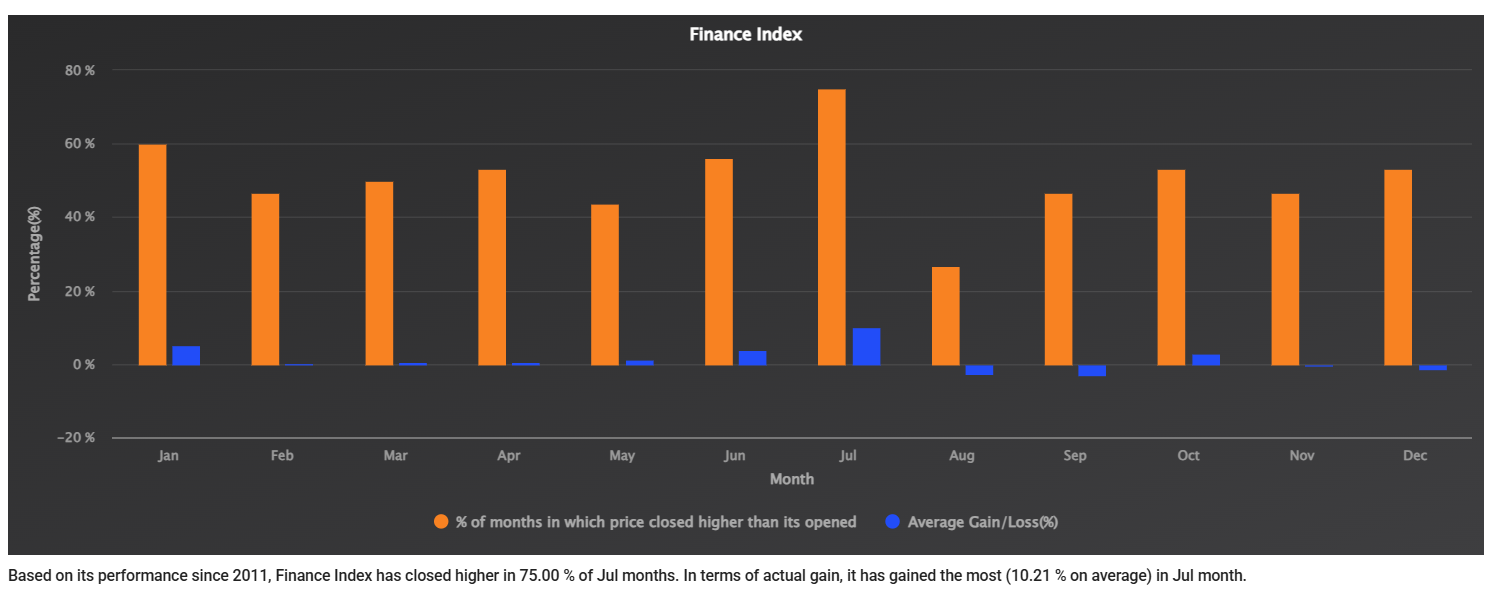
The Finance Index also experiences a pronounced July effect, closing higher in 75% of Julys while producing an average gain of 10.21%, the strongest monthly return in its historical record. Although its winning probability is lower than that of banking and development banks, the magnitude of July gains indicates that finance companies often experience sharp price appreciation during periods of improving investor sentiment.
Interestingly, June also posts a relatively strong average gain of 3.95%, suggesting that buying interest often begins before the fiscal year officially concludes. However, August and September have historically erased part of these gains, both recording negative average returns. This pattern implies that finance stocks are particularly sensitive to shifts between dividend optimism and post-announcement profit-taking.
Microfinance Index
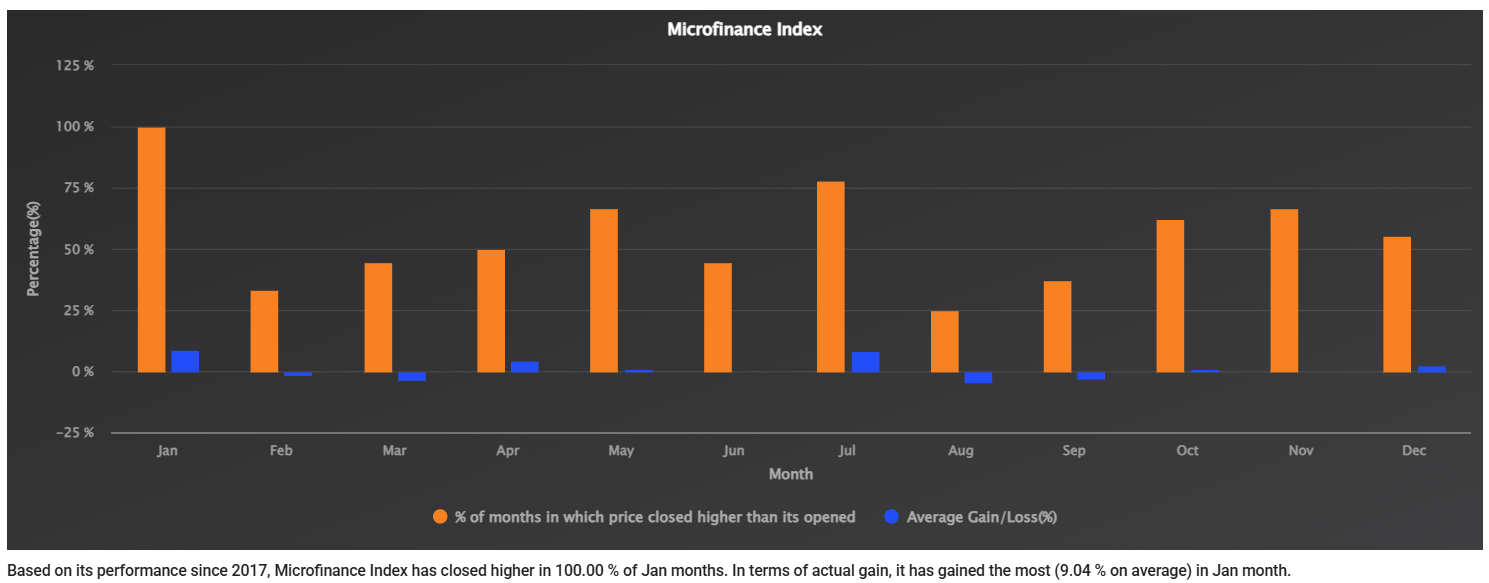
The Microfinance Index displays a unique seasonal profile. Since its inception in 2017, January - (Poush and Magh) has delivered a perfect 100% winning rate with an average return of 9.04%, making it the strongest calendar month for the sector. This is because, market dividend season almost finished but trader start to concentrate on low cap and fundamentally strong with strong regulator body (NRB) sector. So, trader invest in trading scripts in Micro finance get price appreciated in this sector. July also performs exceptionally well, recording a 77.78% winning frequency and an average gain of 8.55%, indicating that investors consistently reward microfinance companies during both the new calendar year and the annual reporting season.
Despite these strong periods, the sector has experienced pronounced weakness during August and September, with average losses exceeding 3 - 4%. These fluctuations suggest that while microfinance companies attract strong momentum during favorable periods, they also tend to experience relatively sharp corrections after optimism subsides.
Hotel and Tourism Index
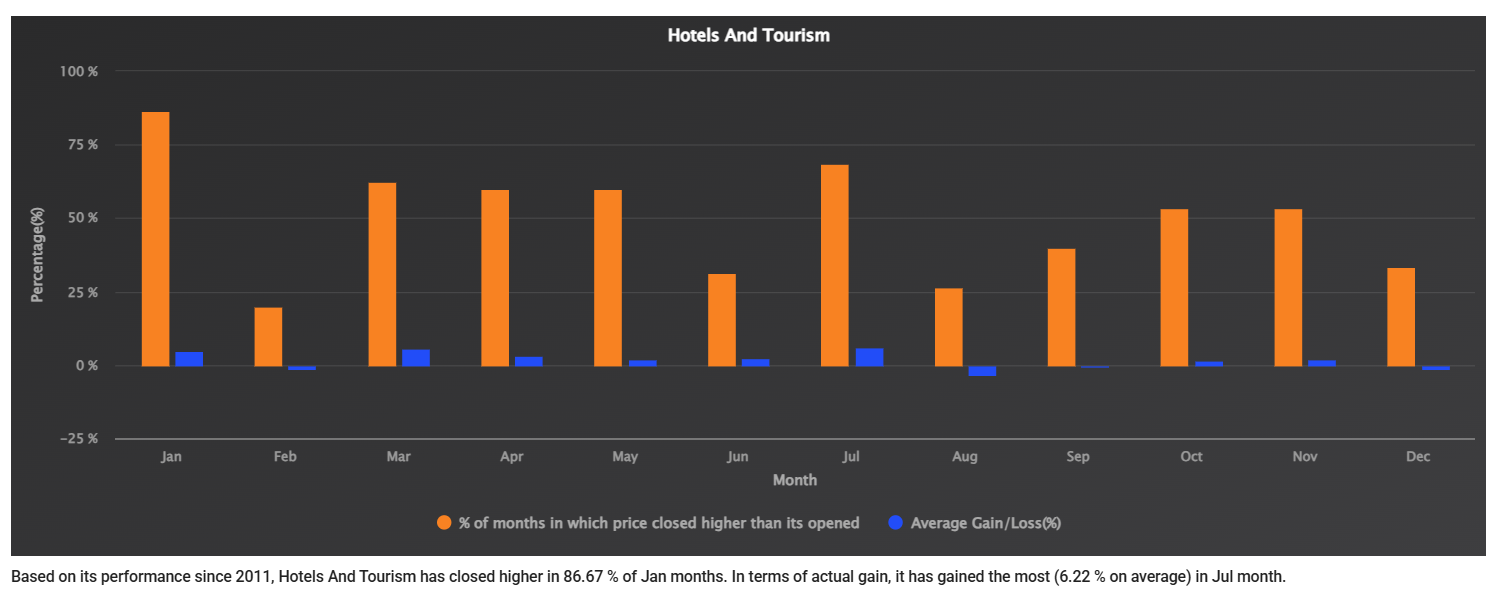
The Hotel and Tourism Index follows a more diversified seasonal pattern than most financial sectors. While July records the highest average return at 6.22%, January has the highest winning probability at 86.67%, indicating that positive performance occurs across multiple parts of the year rather than being concentrated solely around the fiscal year-end.
March also delivers surprisingly strong average gains of 5.63%, highlighting that tourism-related stocks may respond to broader economic or business expectations beyond dividend announcements alone. Nevertheless, August and December have historically been weaker months, suggesting that investor enthusiasm tends to diminish after periods of strong seasonal performance.
Hydropower Index
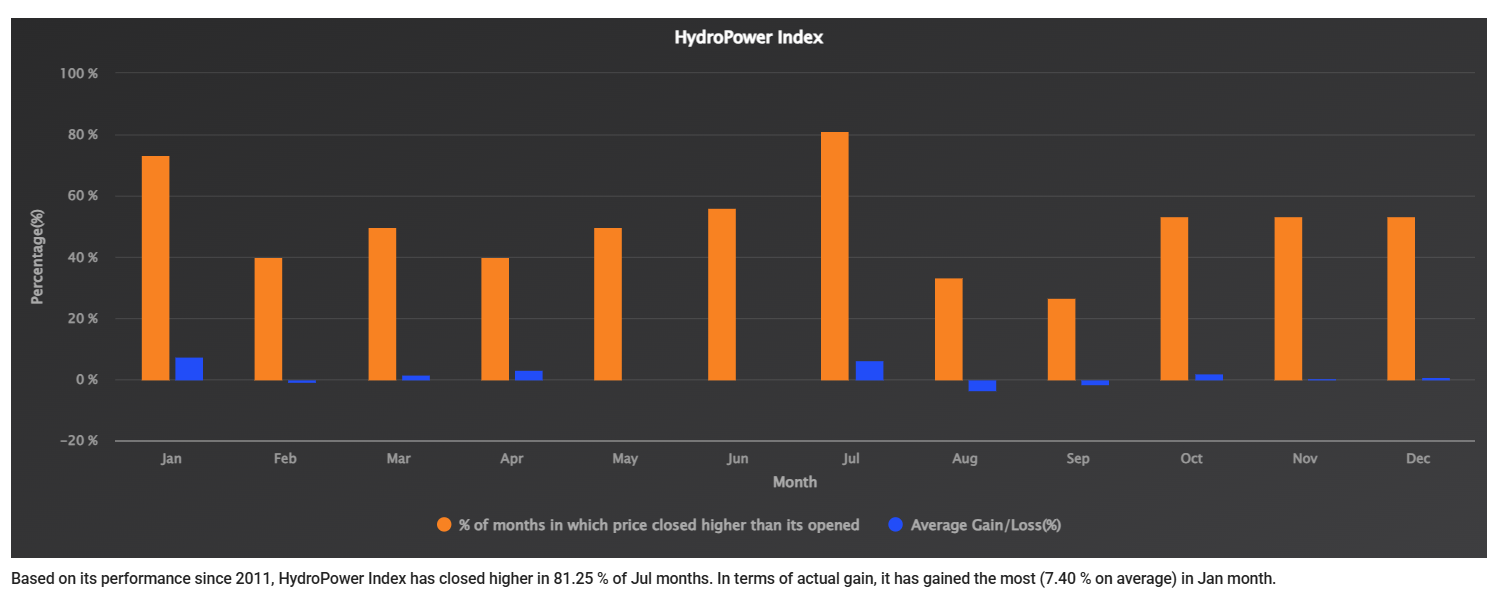
The Hydropower Index exhibits strong seasonality but differs slightly from other sectors. While July maintains a high winning probability of 81.25%, the largest average monthly return occurs in January, reaching 7.40%. This indicates that hydropower stocks have historically generated strong returns during both the beginning of the calendar year and the start of the fiscal year.
Unlike financial institutions, hydropower companies are often influenced by project completion, regulatory developments, and long-term investment themes. Even so, August and September have consistently produced negative returns, reflecting broad market weakness rather than sector-specific fundamentals. Overall, the sector demonstrates relatively balanced seasonal strength across multiple months.
Life Insurance Index
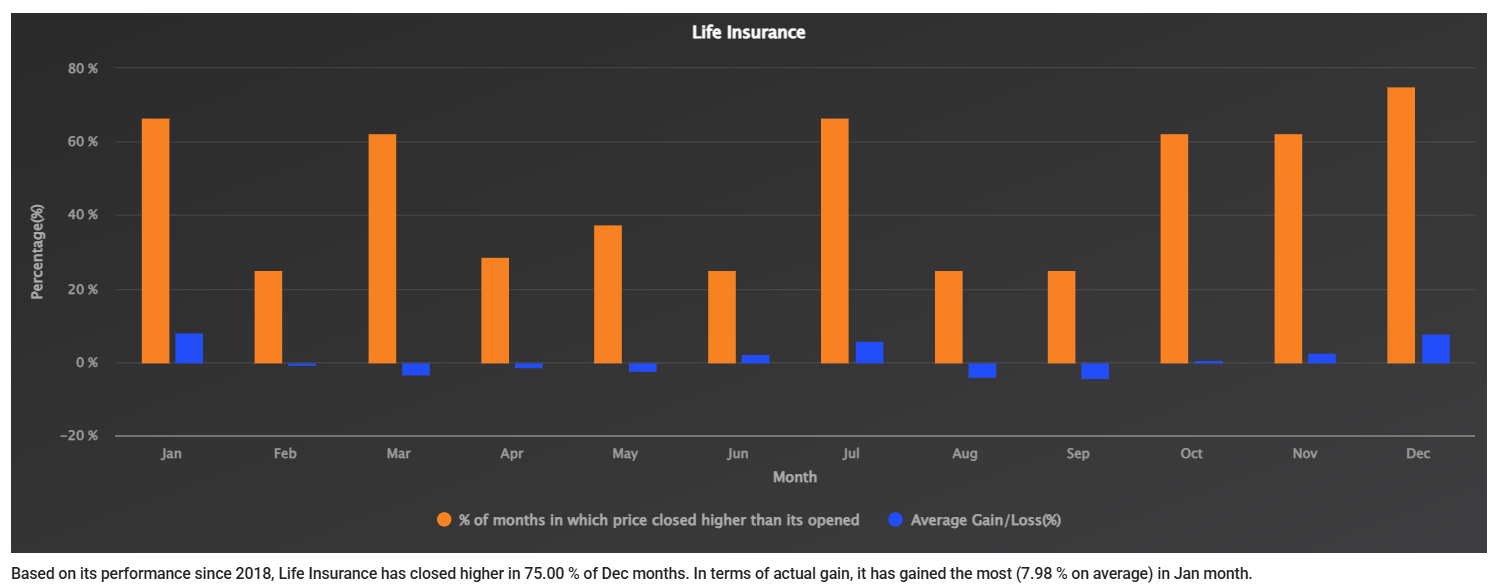
Although the Life Insurance Index records its highest winning probability in December (75%), January has historically generated the strongest average monthly gain of 7.98%. July also performs well, producing a 66.67% winning rate and an average return of 5.78%, indicating that insurance stocks continue to benefit from dividend-related optimism despite slightly lower consistency than banking stocks.
The sector experiences its weakest period during August and September, where average losses exceed 4%. This suggests that life insurance companies tend to experience stronger momentum during year end positioning and fiscal reporting periods before entering a seasonal correction phase.
Non - Life Insurance Index
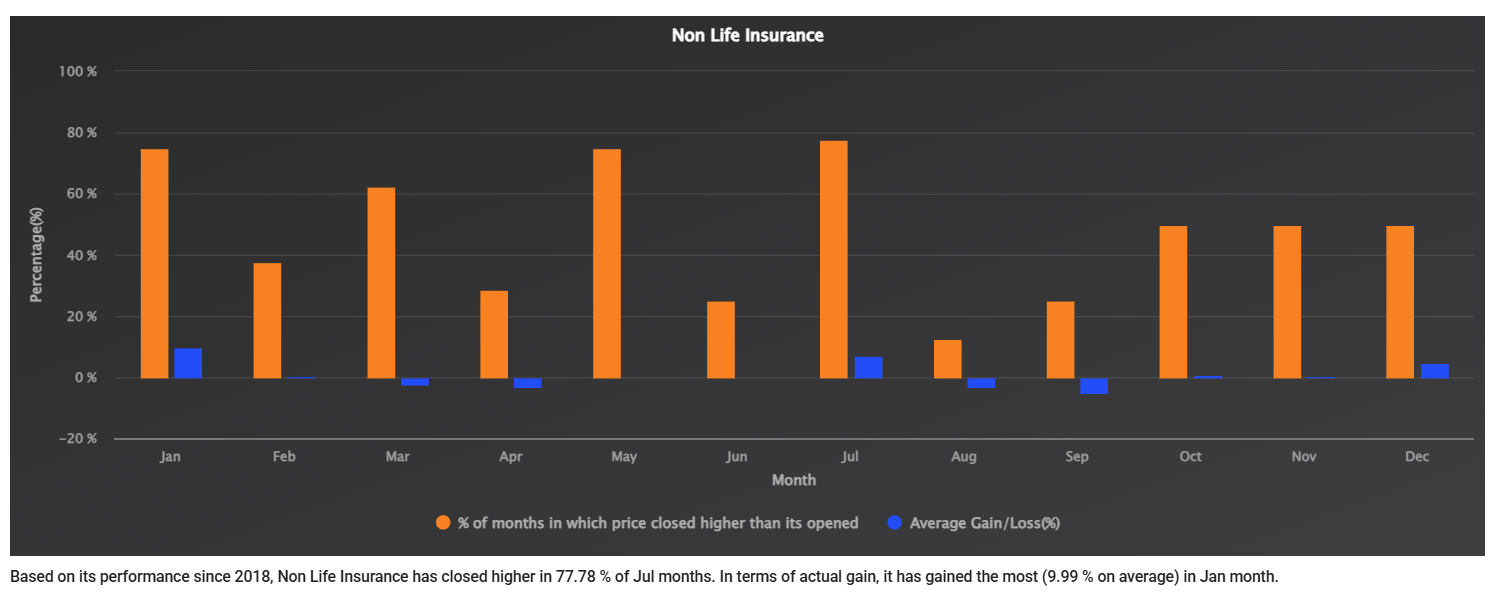
The Non-Life Insurance Index combines strong January and July performance. January produces the highest average monthly return of 9.99%, while July records a 77.78% winning frequency and an average gain of 7.25%. These statistics indicate that investor confidence in non-life insurers tends to strengthen during periods associated with earnings visibility and portfolio rebalancing.
However, the sector also exhibits relatively high volatility. August and September generate some of the largest average monthly losses among all indices, reaching -3.08% and -5.21%, respectively. This sharp reversal suggests that strong rallies are often followed by equally notable corrections.
Manufacturing & Processing Index
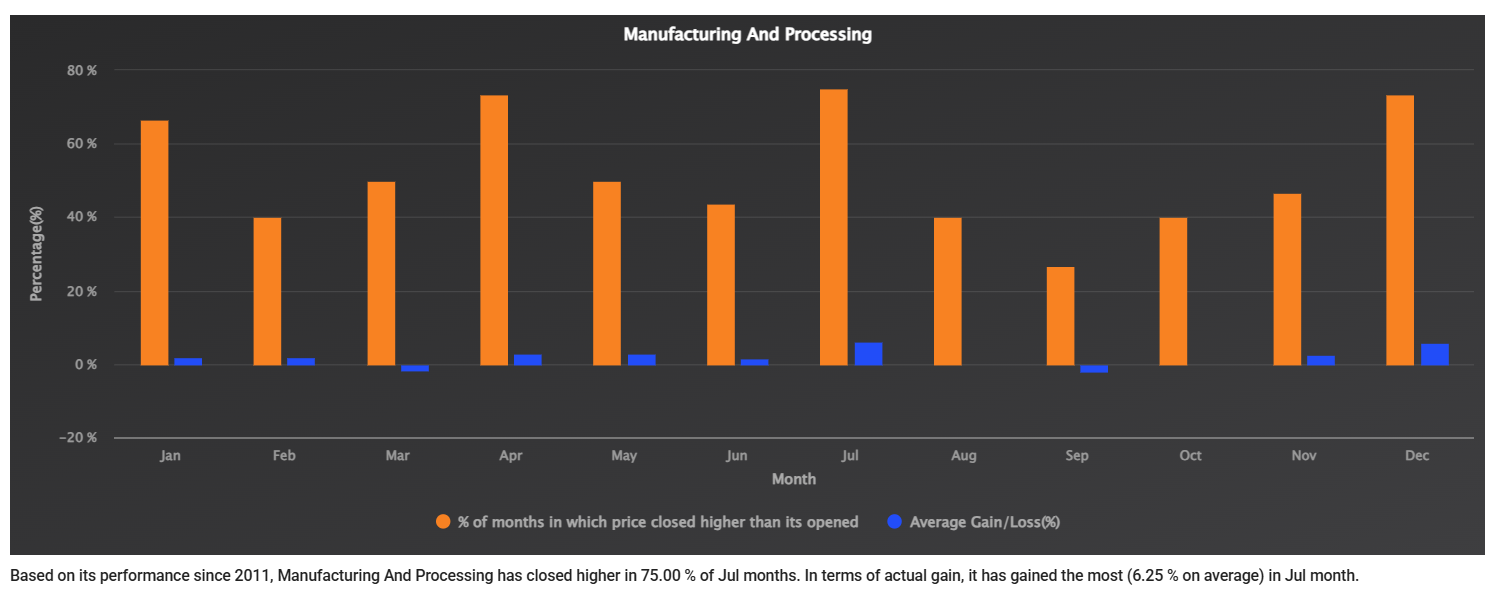
The Manufacturing & Processing Index demonstrates stable seasonal performance with July producing both the highest average return (6.25%) and a strong 75% winning probability. Unlike several financial sectors, the index also performs well in December, where average gains approach 6%, suggesting broader year end strength.
Performance remains relatively balanced throughout the rest of the year, with only modest declines during March, September, and October. This indicates that manufacturing companies are generally less affected by extreme seasonal swings and instead exhibit comparatively steady performance over time.
Mutual Fund Index
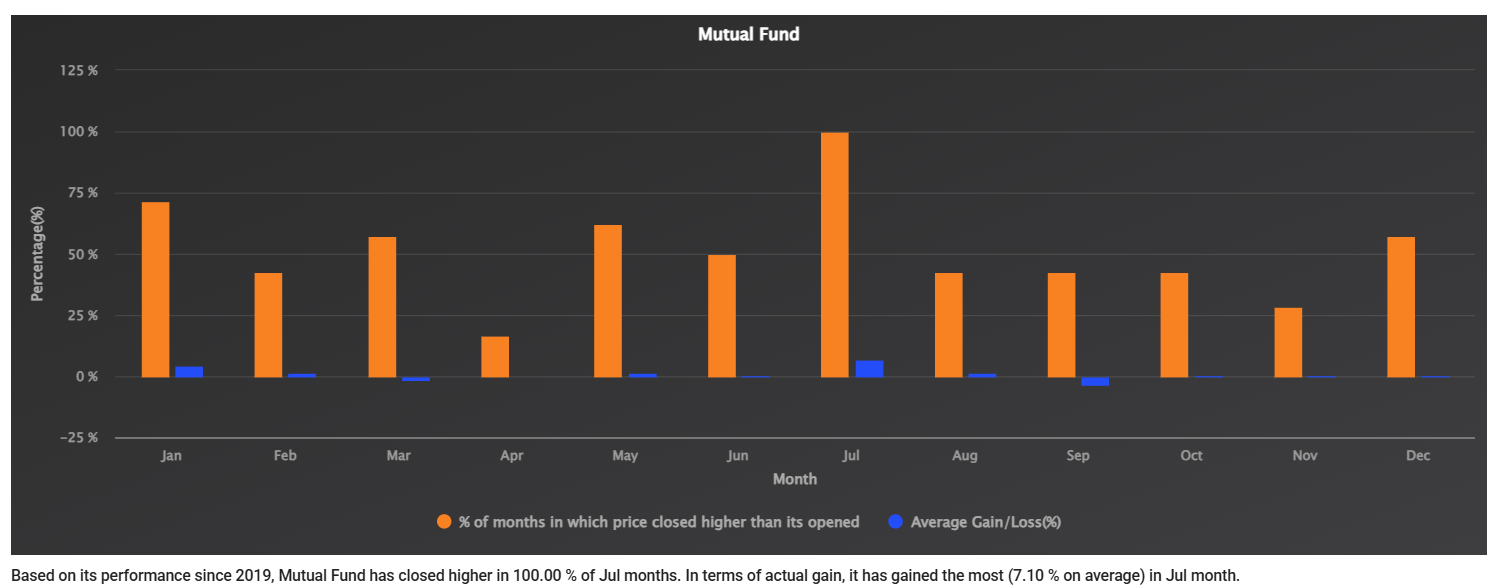
Despite its relatively short trading history, the Mutual Fund Index has delivered a perfect July record, closing higher in 100% of observed Julys while generating an average gain of 7.10%. This consistency suggests that investors frequently allocate capital to listed mutual funds during the beginning of the new fiscal year as overall market sentiment improves.
Outside July, January also records healthy returns of 4.21%, while August surprisingly remains positive despite weakness across many other sectors. Nevertheless, because the dataset begins only in 2019, these seasonal conclusions should be interpreted cautiously until a longer historical record becomes available.
Others Index
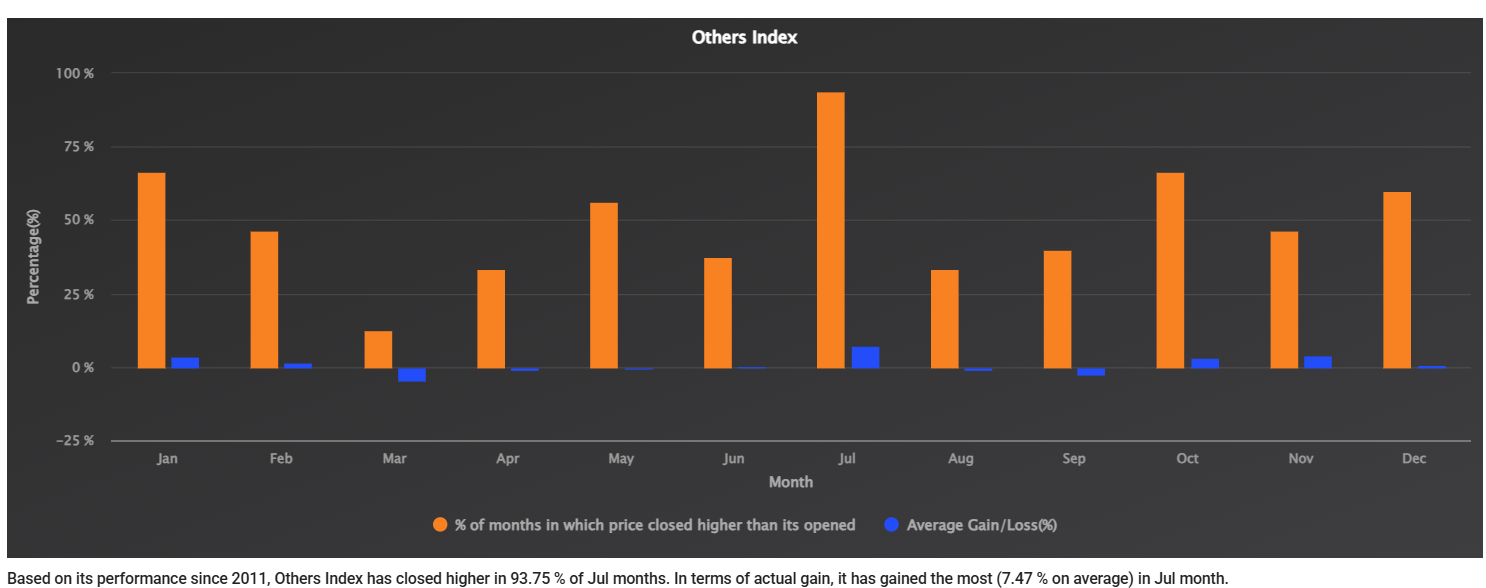
The Others Index displays one of the strongest July seasonal tendencies among all sectoral indices. Since 2011, it has closed higher in 93.75% of Julys while producing an average monthly gain of 7.47%. Such consistency indicates that companies classified under this category generally benefit from the broad market optimism surrounding annual financial disclosures.
Interestingly, November also generates strong average gains of 4.18%, making it another historically favorable period. In contrast, March, April, August, and September have delivered relatively weak returns, reflecting the broader seasonal softness observed across the Nepalese equity market.
Trading Index
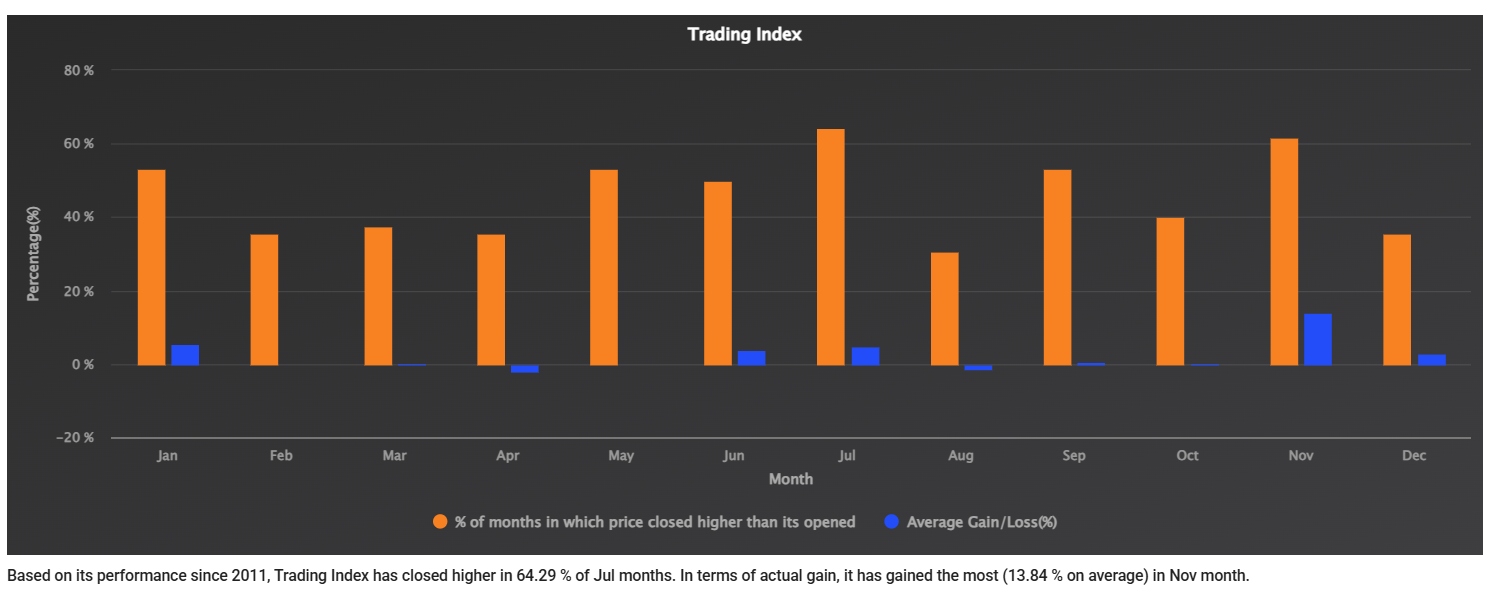
Unlike most sectors, the Trading Index does not experience its strongest seasonal performance in July. Although July still records a respectable 64.29% winning rate and an average gain of 4.95%, the index's standout month is November, where average returns reach an impressive 13.84%, the highest monthly gain among all sectoral indices.
This unique behavior suggests that trading companies are influenced by factors beyond dividend expectations, including inventory cycles, festive-season demand, and business activity. While July remains favorable, investors should recognize that the Trading Index follows a distinctly different seasonal pattern from the broader market.
Investment Index
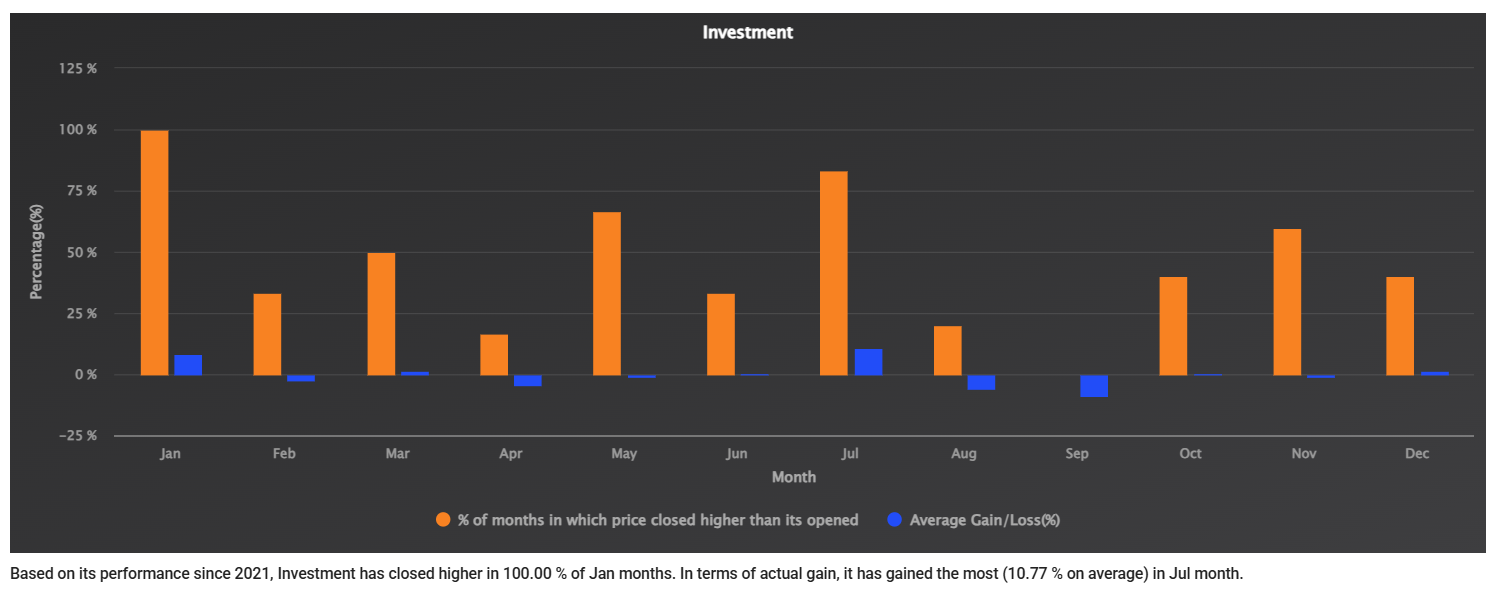
Although the Investment Index has the shortest available history, it already demonstrates a remarkably strong July pattern. Since 2021, July has produced an average gain of 10.77%, the highest among all months, while closing positive in 83.33% of observations. January has also maintained a 100% winning record with an average gain of 8.39%, suggesting sustained investor optimism during the early part of both the fiscal and calendar years.
However, the index also exhibits the highest downside volatility among several sectors. August and September record average losses of 5.81% and 8.69%, respectively, indicating that strong rallies have historically been followed by substantial corrections. Given the limited sample size, these patterns should be viewed as emerging trends rather than statistically conclusive evidence.
Conclusion
The historical data suggests that July (Shrawan) has consistently been the strongest month for the Nepalese stock market, with the NEPSE Index and most sectoral indices recording both their highest probability of positive returns and their strongest average monthly gains. This recurring pattern is largely driven by the publication of annual financial results, dividend expectations, and renewed investor participation at the beginning of the new fiscal year.
However, seasonality should be viewed as a historical tendency rather than a prediction. While these patterns can help investors understand market behavior and improve portfolio timing, investment decisions should also consider company fundamentals, valuation, macroeconomic conditions, liquidity, and prevailing market sentiment. Combining seasonal analysis with fundamental and technical analysis provides a more balanced and informed investment approach.
Note: Data and facts presented in this article are sourced from SS Pro by ShareSansar.

