

FMDBL vs. RSDC vs. SKBBL: A Fourteen-Year Comparative Financial Performance Review (Q4 2069/70–Q4 2082/83)
Fri, Aug 7, 2026 10:40 AM on Financial Analysis, Company Analysis, Latest,
.png)
Currently, three wholesale microfinance institutions operate in Nepal: First Microfinance Laghubitta Bittiya Sanstha Limited (FMDBL), RSDC Laghubitta Bittiya Sanstha Limited (RSDC), and Sana Kisan Bikas Laghubitta Bittiya Sanstha Limited (SKBBL). This article compares their financial performance based on the Q4 financial statements over the past 14 years (or from the year of establishment for institutions that have not yet completed 14 years of operation).
Before proceeding with this comparative analysis, you may wish to read the individual financial performance reviews of each institution through the links below:
This comparative review covers the following major financial aspects:
Balance Sheet
Assets:
1. Cash and Cash Equivalent
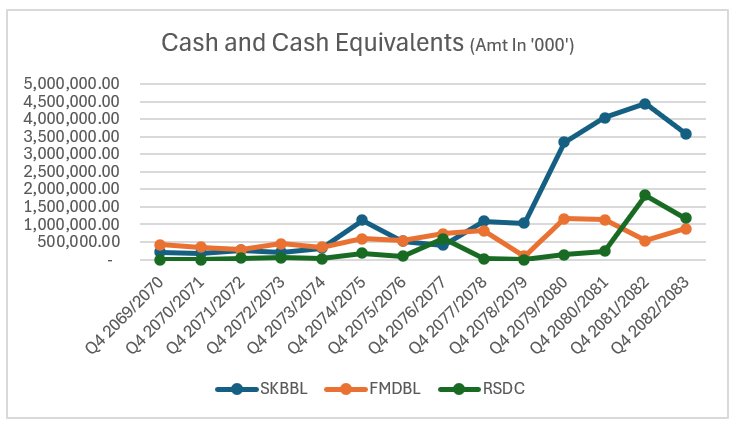
Cash and cash equivalents increased across all three wholesale microfinance institutions during the review period, although the scale of growth varied considerably. SKBBL maintained the largest cash balance, increasing from Rs. 20.60 crore in Q4 2069/70 to Rs. 3.58 billion in Q4 2082/83, largely reflecting its significantly larger balance sheet and the impact of the RMDC merger. RSDC's cash holdings increased from Rs. 3.39 crore to Rs. 1.18 billion, while FMDBL's cash and cash equivalents grew from Rs. 42.20 crore to Rs. 88.05 crore. Although adequate liquidity is essential, holding excessive cash beyond regulatory requirements is generally considered inefficient for wholesale lending institutions.
2. Loan and advances to MFIs & Cooperatives
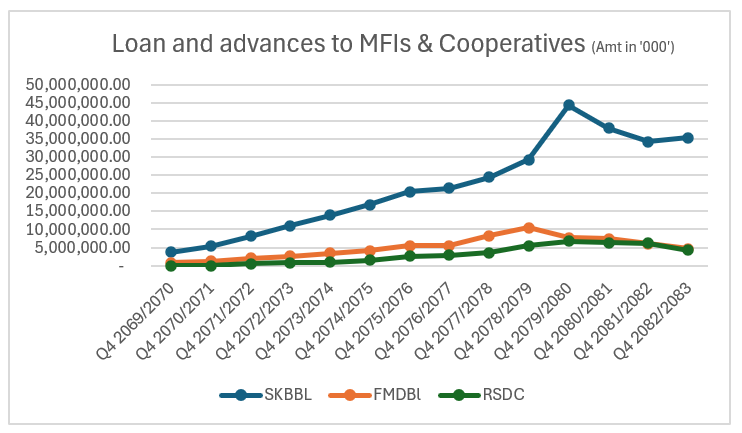
Lending to MFIs and cooperatives remained the core business of all three wholesale microfinance institutions. Among them, SKBBL maintained the largest lending portfolio, increasing from Rs. 3.63 billion to Rs. 35.39 billion, with a median annual growth rate of 20.70%. FMDBL recorded the highest median lending growth rate of 27.07%, expanding its portfolio from Rs. 75.85 crore to Rs. 4.65 billion. RSDC followed closely with a median annual growth rate of 23.29%, increasing its lending portfolio from Rs. 50.71 crore to Rs. 4.24 billion. All three institutions achieved their highest lending portfolios around FY 2078/79–2079/80 before experiencing a gradual decline in recent years.
3. Total Assets
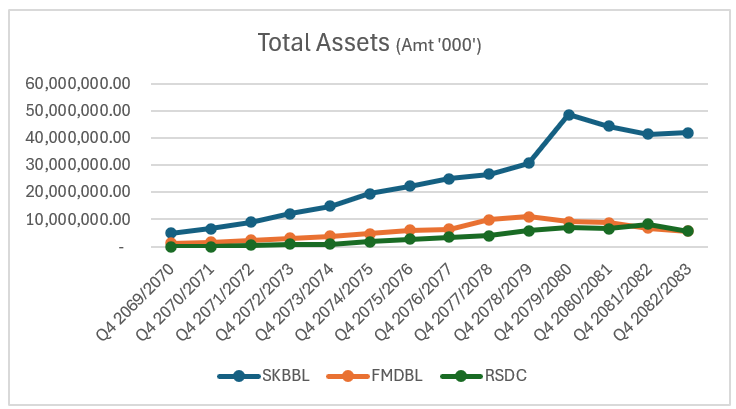
SKBBL dominates the wholesale microfinance sector in terms of balance sheet size, while FMDBL and RSDC have demonstrated faster asset growth rates over their respective review periods. The comparison indicates that SKBBL has maintained its leadership through scale and the RMDC merger, whereas FMDBL and RSDC have achieved stronger organic asset growth, albeit from a much smaller base.
Liabilities
1. Borrowing
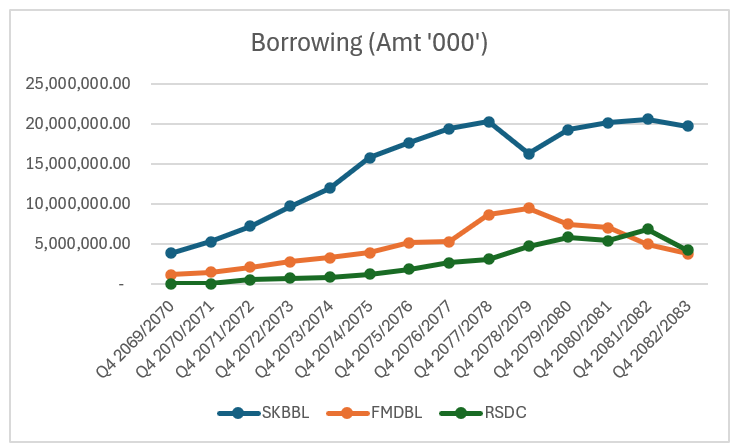
RSDC demonstrated the fastest borrowing growth, while FMDBL maintained a similarly high dependence on borrowed funds. SKBBL, despite remaining the largest wholesale microfinance institution, has gradually reduced its dependence on borrowings relative to total liabilities, reflecting a stronger capital base and a more diversified funding structure following its merger.
2. Total liabilities
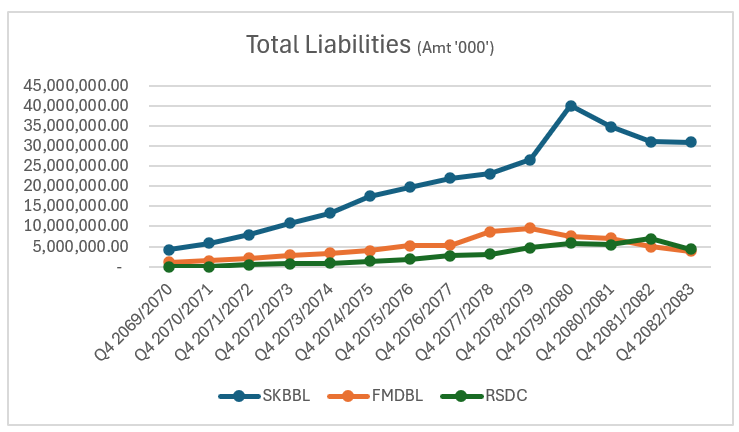
SKBBL maintained the largest liability base due to its significantly larger scale of operations and the impact of the RMDC merger, while FMDBL and RSDC exhibited relatively faster liability growth from smaller initial bases. Across all three institutions, borrowings continued to constitute the largest share of total liabilities, highlighting the wholesale funding model that characterizes Nepal's wholesale microfinance sector.
3. Share capital
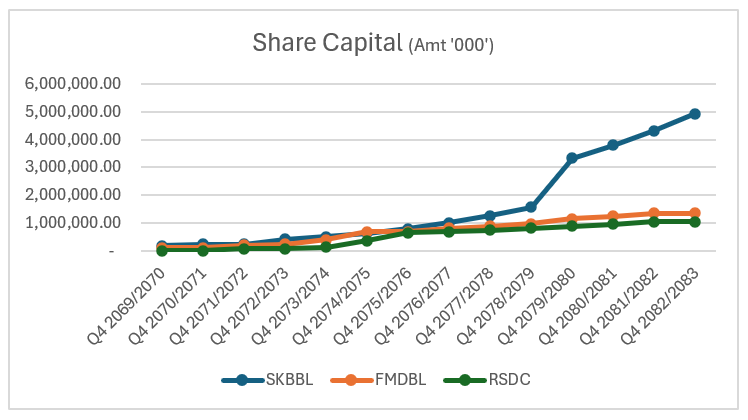
SKBBL recorded the highest growth in share capital due to the RMDC merger and its aggressive capital expansion strategy, while FMDBL and RSDC maintained comparatively moderate and stable capital growth. Although a stronger capital base enhances lending capacity and financial resilience, the experience of SKBBL demonstrates that rapid capital expansion without a corresponding increase in profitability can temporarily dilute shareholder returns, particularly Earnings Per Share (EPS) and Return on Equity (RoE).
3. Total equity
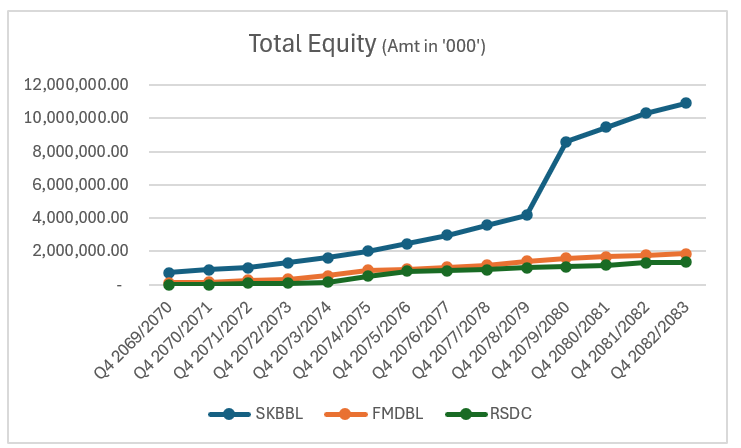
SKBBL recorded the strongest growth in total equity, primarily due to the RMDC merger and substantial capital expansion. FMDBL ranked second, benefiting from robust reserve accumulation despite relatively moderate share capital growth, while RSDC demonstrated the most stable and gradual equity growth among the three institutions. The comparison indicates that all three wholesale microfinance institutions have strengthened their capital positions over time, although they have followed different approaches to building shareholders' equity.
Profit and Loss
1. Interest income
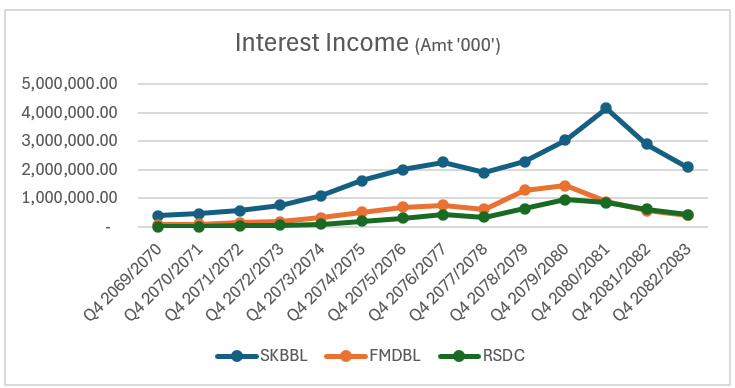
SKBBL generated the highest interest income due to its substantially larger lending portfolio, while FMDBL and RSDC exhibited similar earnings patterns, with both institutions benefiting from lower borrowing costs during the recent easing interest rate cycle. The comparison indicates that although interest income has declined across the wholesale microfinance sector in recent years, effective management of funding costs has helped FMDBL and RSDC maintain relatively stable net interest margins, whereas SKBBL has experienced greater pressure on its interest spread following its rapid balance sheet expansion.
2. Net interest income
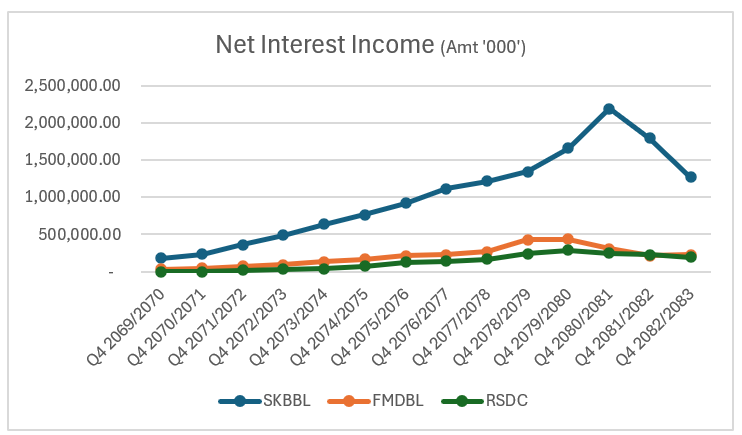
SKBBL generated the highest net interest income in absolute terms because of its significantly larger scale of operations, while FMDBL and RSDC demonstrated comparatively better resilience in protecting their net interest margins during the declining interest rate cycle. This comparison suggests that effective funding cost management has become increasingly important for wholesale microfinance institutions as lending yields continue to moderate.
3. Personnel expense
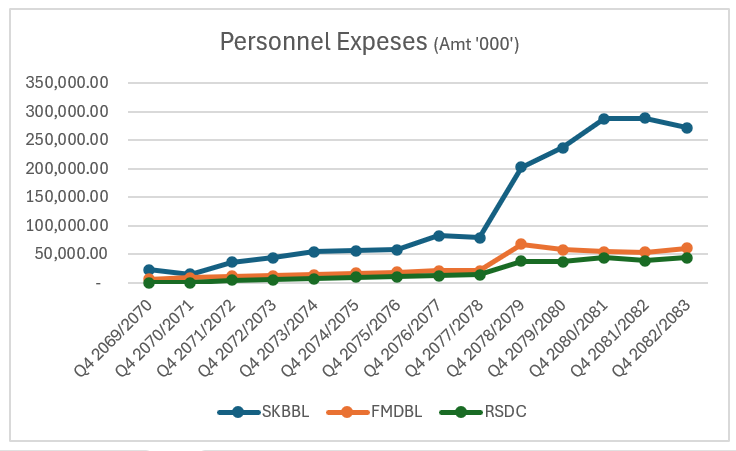
SKBBL incurred the highest personnel expenses due to its larger operational scale and the impact of the RMDC merger, while FMDBL maintained a relatively stable personnel cost structure. RSDC, although operating on a smaller scale, experienced the most significant increase in staff costs during FY 2078/79, highlighting the importance of aligning personnel expenses with business growth and operating efficiency.
4. Other operating expense
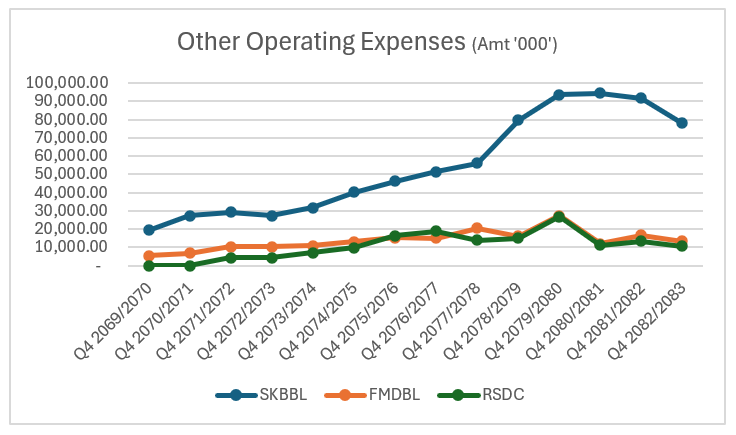
All three wholesale microfinance institutions demonstrated disciplined control over other operating expenses. While SKBBL incurred the highest operating expenses because of its larger operational scale and merger-related integration, FMDBL and RSDC maintained relatively lean operating cost structures. The comparison indicates that administrative expenses have not been a major factor affecting the profitability of Nepal's wholesale microfinance institutions, with financing costs continuing to represent the dominant component of total operating expenses.
5. Profit for the period
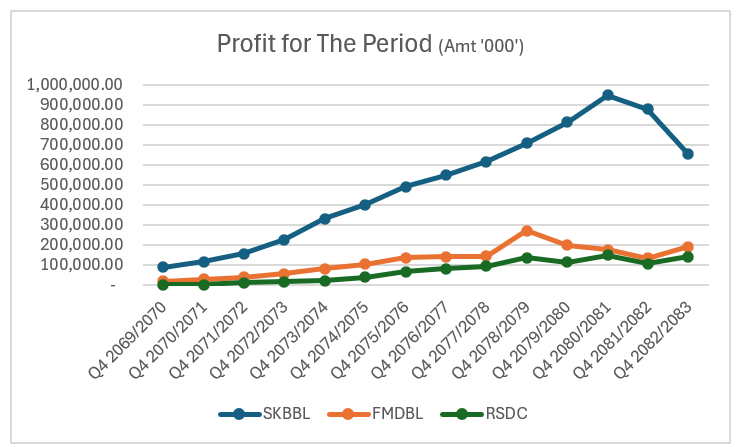
SKBBL remained the most profitable wholesale microfinance institution in absolute terms, owing to its significantly larger scale of operations, while FMDBL and RSDC generated comparatively smaller but relatively stable profits. The comparison indicates that although all three institutions experienced declining profitability in recent years, they have continued to remain profitable, demonstrating the resilience of Nepal's wholesale microfinance business model despite a more challenging operating environment.
Key Indicators
1. Basic Earnings per Share (EPS Annualized - Rs.)
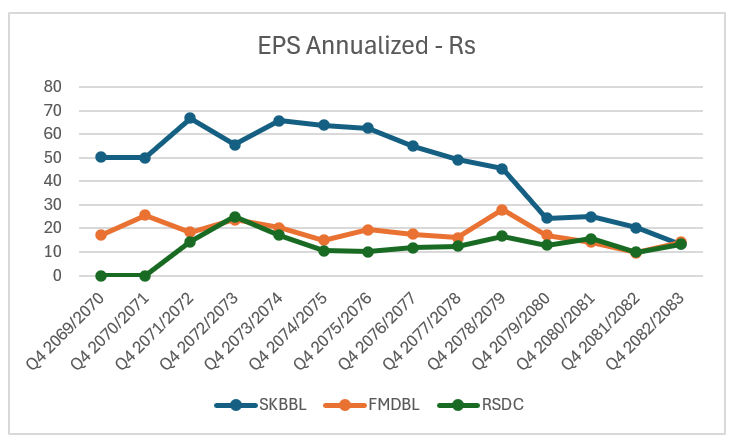
SKBBL recorded the highest historical EPS but also experienced the most pronounced decline following its merger with RMDC, while FMDBL demonstrated the most stable EPS performance over the review period. RSDC maintained a moderate and relatively consistent earnings profile, reflecting steady business growth without significant capital dilution. The comparison suggests that although larger institutions may generate higher absolute profits, sustained growth in EPS depends on balancing profitability with capital expansion.
3. Networth per Share (Rs.)
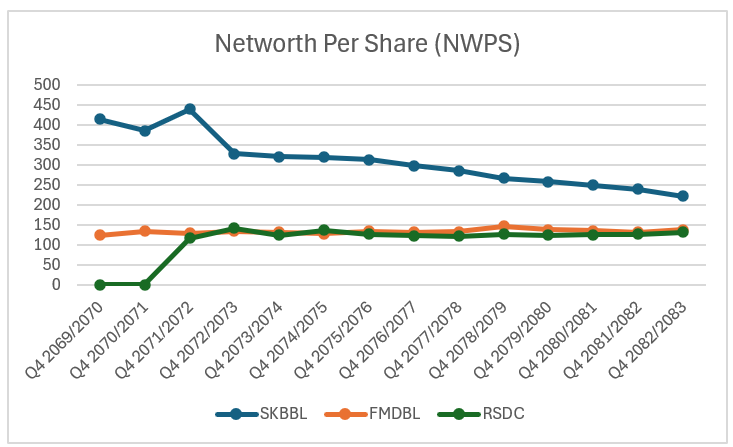
SKBBL possessed by far the strongest capital base, as reflected in its average Net Worth Per Share of Rs. 309.85, more than double that of FMDBL (Rs. 132.88) and RSDC (Rs. 125.22). While the higher NWPS demonstrates SKBBL's superior financial strength, FMDBL and RSDC achieved comparatively better balance between capital growth and per-share profitability, indicating more efficient utilization of shareholders' equity over the review period.
4. Return on Equity (%)
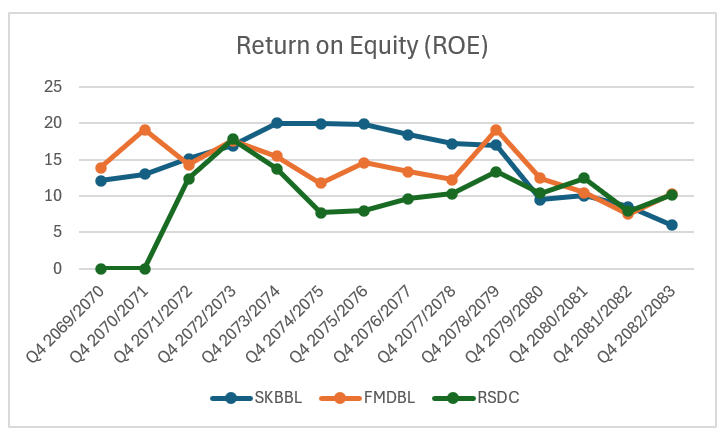
SKBBL recorded the highest historical Return on Equity, reaching 20.00%, demonstrating superior shareholder returns during its pre-merger years. However, FMDBL and RSDC currently generate slightly stronger returns on equity, reporting 10.33% and approximately 10.20%, respectively, compared with SKBBL following its post-merger decline. The comparison highlights that while a larger capital base strengthens financial stability, sustained RoE ultimately depends on the institution's ability to generate earnings commensurate with shareholders' equity.
5. Return on Assets (%)
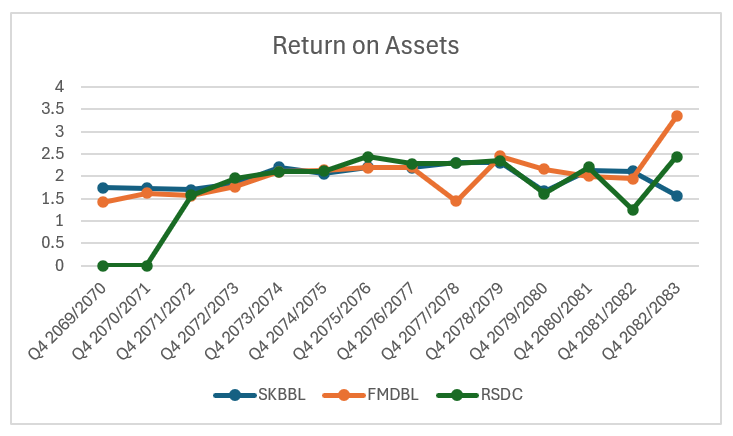
FMDBL recorded the strongest Return on Assets among the three wholesale microfinance institutions, reaching 3.35% in Q4 2082/83, demonstrating the most efficient utilization of its assets to generate earnings. RSDC also maintained healthy asset efficiency, while SKBBL, despite possessing the largest asset base, recorded the lowest RoA following its merger with RMDC, highlighting the challenge of generating proportionately higher profits from a significantly expanded balance sheet.

