

Sana Kisan Bikas Laghubitta Bittiya Sanstha Limited (SKBBL): A Fourteen - Year Financial Performance Review (Q4 2069/70 - Q4 2082/83)
Sun, Aug 2, 2026 11:02 PM on Financial Analysis, Company Analysis,
.png)
Background of Sana Kisan Bikas Laghubitta Bittiya Sanstha Limited (SKBBL)
Sana Kisan Bikas Laghubitta Bittiya Sanstha Ltd. (SKBBL), formerly known as Sana Kisan Bikas Bank Ltd., was established on July 6, 2001. Later, with the implementation of the Bank and Financial Institution Act, 2073, the bank was renamed Sana Kisan Bikas Laghubitta Bittiya Sanstha Ltd. (SKBBL).
Following the merger of two esteemed wholesale lending microfinance institutions RMDC Laghubitta Bittiya Sanstha Ltd. and Sana Kisan Bikas Laghubitta Bittiya Sanstha Ltd. on July 9, 2023 (Asadh 24, 2080), SKBBL has been operating as a wholesale lending microfinance institution headquartered in Babarmahal, Kathmandu.
It is one of Nepal's three wholesale microfinance institutions. SKBBL is the largest institution in its category based on balance sheet size. Its business model involves borrowing funds from upper-class BFIs and lending them to retail microfinance institutions. It plays the role of a financial intermediary. The organization has completed 25 years of operation. This article evaluates its 14-year financial journey and performance over the period from Q4 2069/70 to Q4 2082/83.
Balance Sheet Analysis
Assets
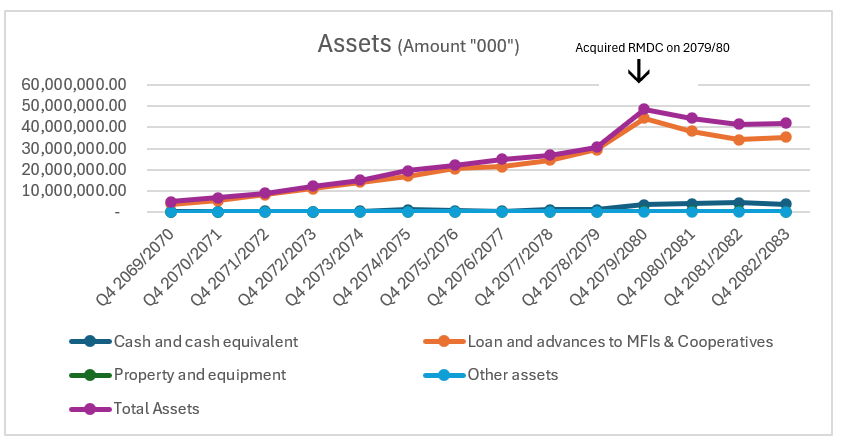
The total assets of SKBBL have followed a steady growth pattern. As of Q4 2069/70, total assets stood at Rs. 4.95 billion, increasing to Rs. 41.09 billion by Q4 2082/83. In the year of the RMDC acquisition, total assets spiked by 58.20%. Over the review period, total assets recorded a median annual growth rate of 14.83%. The trends of the major asset components are discussed below.
1. Cash and Cash Equivalents
Cash and cash equivalents increased from Rs. 20.60 crore to Rs. 3.58 billion. Holding cash and cash equivalents above the regulatory requirement is generally not considered efficient for banks.
2. Loans and Advances to MFIs & Cooperatives
Lending to MFIs and cooperatives has successfully expanded SKBBL's core lending business. In the year of the RMDC acquisition, loans and advances increased by 51.39%. Loans and advances recorded a median annual growth rate of 20.70%, increasing from Rs. 3.63 billion in Q4 2069/70 to Rs. 35.39 billion by Q4 2082/83. During the 15-year review period, SKBBL achieved its highest lending portfolio of Rs. 44.43 billion in Q4 2079/80. Since then, the lending portfolio has been on a declining trend.
3. Total Assets
Within total assets, loans and advances to MFIs accounted for 73.32% in Q4 2069/70, increasing to 84.27% by Q4 2082/83. Other asset components did not account for a significant share of total assets.
Liabilities
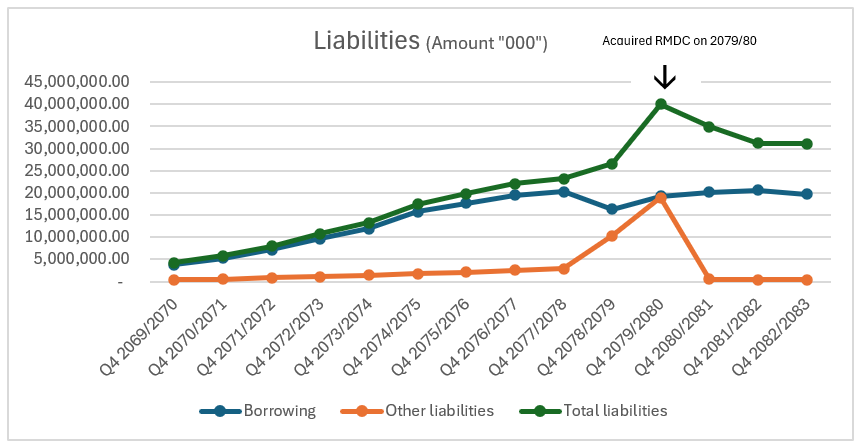
Total liabilities (excluding equity) stood at Rs. 4.24 billion in Q4 2069/70. They increased by 7.32 times, reaching Rs. 31.06 billion by Q4 2082/83. Borrowings, the institution's core liability, grew at a median annual rate of 12.06%, increasing from Rs. 3.78 billion to Rs. 19.76 billion. Meanwhile, total liabilities and equity combined increased from Rs. 4.95 billion to Rs. 41.99 billion. The major liability trends are discussed below.
1. Borrowings
Borrowings from upper-class BFIs and other institutions increased at a median annual rate of 12.06%. Within total liabilities (excluding equity), borrowings accounted for 89.32% in Q4 2069/70 but declined significantly to 63.58% by Q4 2082/83. This indicates that the institution is not relying solely on borrowings, suggesting that it is increasingly utilizing its own equity to finance its business. Nevertheless, the institution still has room to expand its business further.
2. Other Liabilities
Other liabilities showed a highly fluctuating trend throughout the review period. In Q4 2069/70, they stood at Rs. 44.71 crore and increased until Q4 2077/78 at a median annual growth rate of 23.14%. They then surged by 255.80%, reaching Rs. 10.29 billion. In the following year, Q4 2079/80, they further increased to Rs. 18.91 billion, mainly due to the acquisition of RMDC. Thereafter, other liabilities declined sharply over the last four years, reaching Rs. 36.98 crore by Q4 2082/83.
3. Total Liabilities
Total liabilities followed a trend similar to that of borrowings and other liabilities. They also reflected the impact of the merger. Overall, total liabilities recorded a median annual growth rate of 14.60%. Excluding the short-term fluctuations in other liabilities, borrowings constituted the largest portion of total liabilities, and their growth closely mirrored the overall liability trend.
4. Equity Analysis
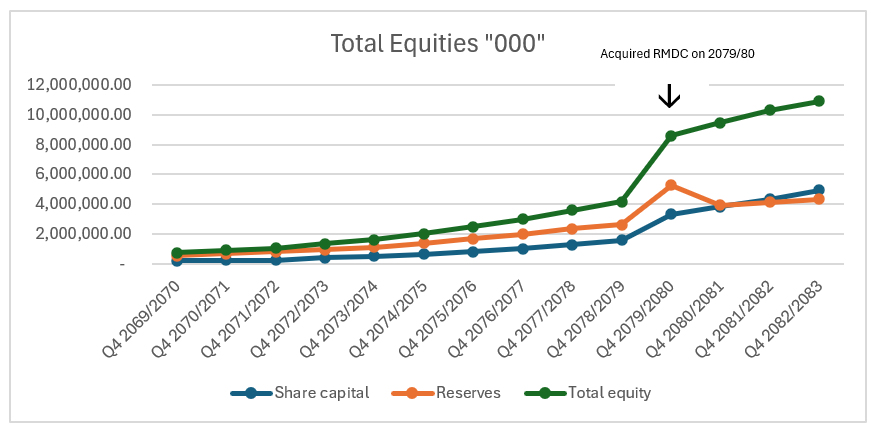
Total equity of SKBBL increased at a median annual growth rate of 20.68%. During the same period, share capital grew at a median annual rate of 25.00%, while reserves increased at a median annual rate of 17.83%.
Profit and Loss Analysis
1. Interest Income and Interest Expense
Interest income and interest expense represent the institution's core revenue-generating activities and the cost of funding those assets, respectively. Interest income declined after reaching its peak of Rs. 4.16 billion in Q4 2080/81. Thereafter, both interest income and interest expense decreased steadily. By Q4 2082/83, interest income had fallen sharply to Rs. 2.08 billion.
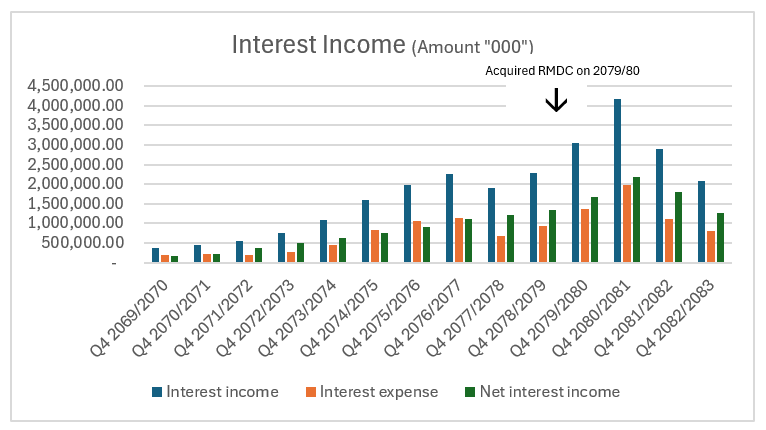
Notably, during the declining interest rate environment, SKBBL's interest expense rate has remained higher than its interest income rate, indicating a narrowing net interest margin. As a result, the net interest margin has declined accordingly. As a wholesale microfinance institution, SKBBL should reduce its interest costs by securing lower-cost borrowings from upper-class BFIs.
2. Operating Profit and Net Profit
Operating profit reflects the institution's profitability before taxation and provisioning, while net profit represents earnings attributable to shareholders.
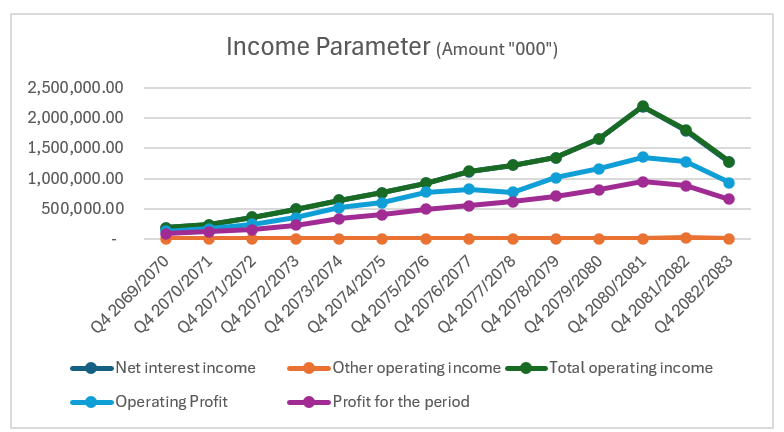
SKBBL recorded its highest-ever net profit of Rs. 1.35 billion in Q4 2080/81. Overall, the institution's net profit has been on a declining trend in recent years.
3. Expenses
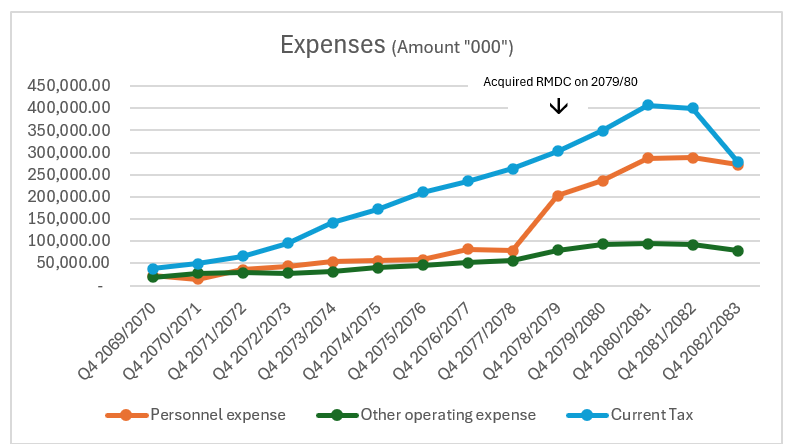
Interest expense remains SKBBL's largest expense and is considered the primary direct cost in the banking industry. This expense has shown a declining trend in line with falling market interest rates. The next major expense is income tax, followed by staff costs. Other operating expenses remained relatively low throughout the review period.
Trends in Key Performance Indicators
Earnings Metrics
Earnings Per Share (EPS)
SKBBL's Earnings Per Share (EPS) has experienced considerable volatility over the past fifteen fiscal years, reflecting changes in profitability and the overall operating environment.
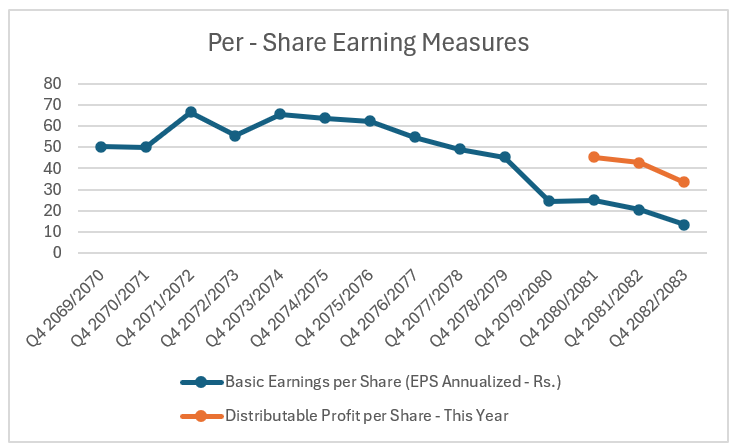
EPS has followed a continuously declining trend, falling from its peak of Rs. 66.73 in Q4 2071/72 to Rs. 13.26 in Q4 2082/83. EPS has been significantly affected by the merger with RMDC.
Efficiency Measures
Return on Equity (RoE)
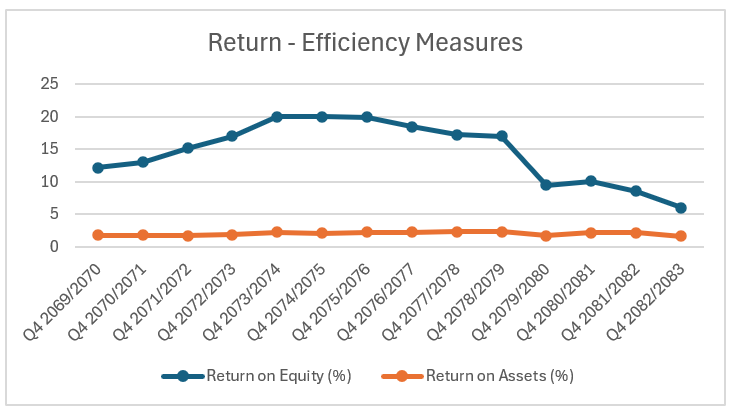
RoE broadly mirrors the movement in EPS. The ratio peaked at 20% in Q4 2074/75 due to strong profitability. Thereafter, it entered a declining trend.
RoE was significantly affected by the merger with RMDC. The institution maintained an RoE above 15% for eight consecutive fiscal years. Following the merger, RoE declined sharply from 17.02% to 9.47% in Q4 2079/80. This was mainly due to overcapitalization relative to profitability.
Return on Assets (RoA)
RoA followed a trajectory similar to that of RoE. During the review period, it reached its highest level of 2.30% in Q4 2078/79, just before the merger, and declined thereafter. Although it rebounded for two years, the ratio has since continued to decline steadily. The FY 2082/83 RoA of 1.56% represents the lowest level during the entire review period, indicating that the institution has been unable to generate profitability in proportion to its growing asset base.
Valuation Multiples
Price-to-Earnings (P/E) Ratio and Price-to-Book (P/B) Ratio
SKBBL's P/E ratio has been highly volatile, mainly due to significant fluctuations in EPS and its market price. The ratio reached a record high of 56.72 times in Q4 2082/83.
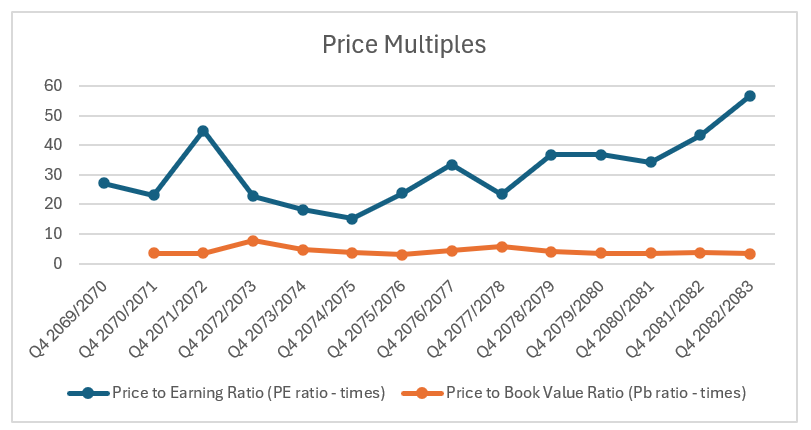
Similarly, the P/B ratio peaked in Q4 2072/73 due to the exceptionally high market price. Thereafter, it consistently remained below 5 times, with a median of 3.64 times over the past fifteen years. This indicates that the market price has been moderately justified by the institution's net worth per share. During the review period, SKBBL maintained an average Net Worth Per Share (NWPS) of Rs. 309.85.
Health Indicators
SKBBL has consistently maintained its Capital Fund to Risk-Weighted Assets Ratio (CAR) at a healthy level, demonstrating a strong capital position.
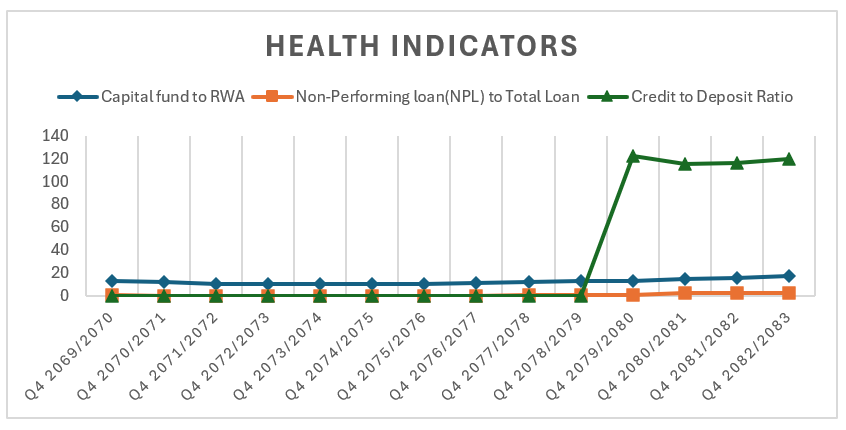
The institution has also maintained an efficient lending position. As of Q4 2082/83, the Credit-to-Deposit (CD) ratio stood at 120%. Since Q4 2079/80, the CD ratio has remained above 100%. This is because SKBBL is a wholesale microfinance institution that primarily engages in institutional borrowing and lending rather than retail deposit collection, making such a ratio acceptable for its business model.
Despite being a wholesale microfinance institution, SKBBL's Non-Performing Loan (NPL) ratio has shown an increasing trend. Before Q4 2079/80, the institution reported very low NPLs. However, since Q4 2077/78, NPLs have gradually increased. As of Q4 2082/83, the NPL ratio stood at only 2.96% of total loans, mainly reflecting the inability of some retail microfinance institutions to repay wholesale borrowings on time.
Dividend History
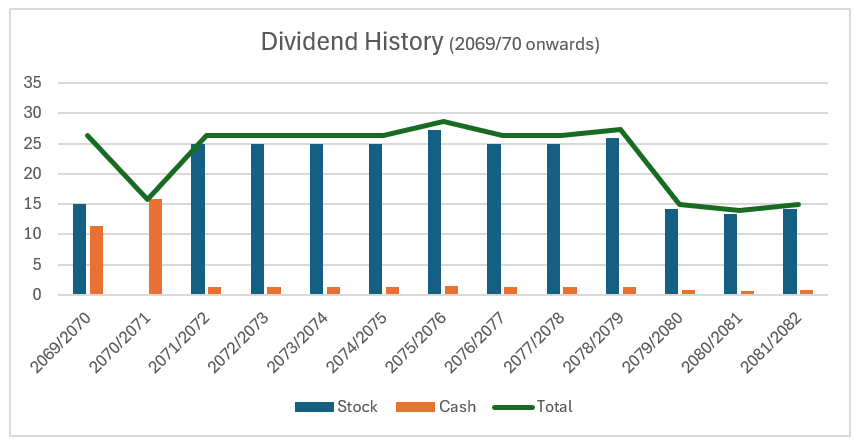
SKBBL has maintained a strong dividend distribution history. The institution declared its highest total dividend of 28.68% in FY 2075/76. Over the review period, SKBBL maintained an average annual total dividend of 23.07%. Although the dividend payout has been moderate, one positive aspect is that the institution has consistently distributed dividends to its shareholders every year.
Data Source: The data used in this article has been obtained from SS Pro by ShareSansar.

