

First Microfinance Laghubitta Bittiya Sanstha Limited (FMDBL): A Fifteen-Year Financial Performance Review (Q4 2069/70 to Q4 2082/83)
Thu, Jul 23, 2026 12:15 PM on Financial Analysis, Company Analysis, Latest,
.png)
Background of First Microfinance Laghubitta Bittiya Sanstha Limited (FMDBL)
First Microfinance Laghubitta Bittiya Sanstha Limited (FMDBL), formerly First Microfinance Development Bank Ltd. (FMDBL), began operations on January 8, 2010 (B.S. 2066 Poush 24) in Kathmandu, Nepal. It is licensed by Nepal Rastra Bank under the Bank and Financial Institution Act, 2073, as a national-level microfinance institution. The organization was founded with the mission of improving the livelihoods of economically and socially disadvantaged people, with a particular focus on agriculture and micro-enterprises through microfinance institutions (MFIs).
It is one of Nepal's wholesale microfinance institutions. Its business model involves borrowing funds from upper-class BFIs and lending them to retail microfinance institutions. It plays the role of a financial funding intermediary. The organization has completed 17 years of operation. This article evaluates its 15-year financial journey and performance over the period from Q4 2069/70 to Q4 2082/83.
Balance Sheet Analysis
Assets
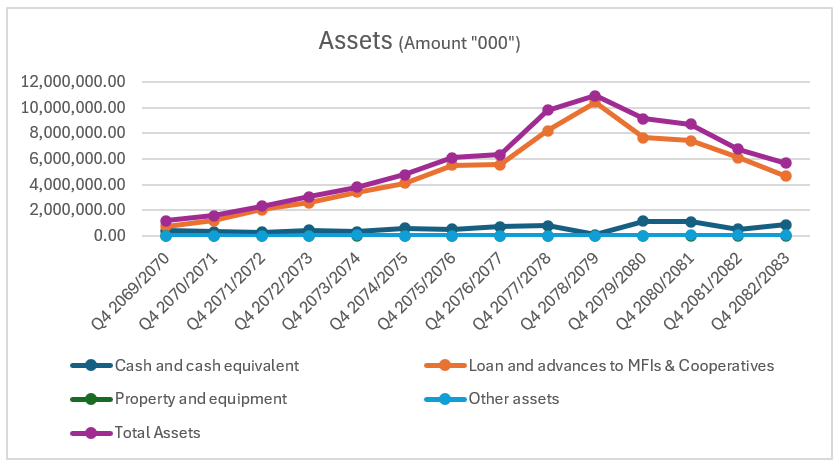
The total assets of FMDBL have followed a steady growth pattern. As of Q4 2069/70, total assets stood at Rs. 1.20 billion, increasing to Rs. 5.69 billion by Q4 2082/83. Over the review period, total assets recorded a median annual growth rate of 24.01%. The trends of the major asset components are discussed below.
1. Cash and Cash Equivalents
Cash and cash equivalents increased from Rs. 42.20 crore to Rs. 88.05 crore. Holding cash and cash equivalents above the regulatory requirement is generally not considered efficient for banks.
1. Loans and Advances to MFIs & Cooperatives
Lending to MFIs and cooperatives has successfully expanded FMDBL's core lending business. Loans and advances recorded a median annual growth rate of 27.07%, increasing from Rs. 75.85 crore in Q4 2069/70 to Rs. 4.65 billion by Q4 2082/83. During the 15 - year review period, FMDBL achieved its highest lending portfolio of Rs. 10.42 billion in Q4 2078/79. Since then, the lending portfolio has been on a declining trend.
3. Total Assets
Within total assets, loans and advances to MFIs accounted for 62.85% in Q4 2069/70, increasing to 81.79% by Q4 2082/83. Other asset components did not hold a significant share of total assets.
Liabilities
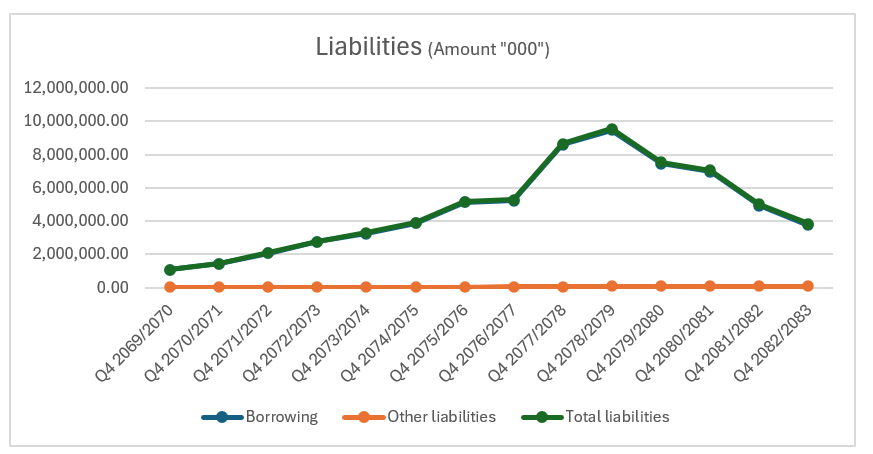
Total liabilities (excluding equity) stood at Rs. 1.08 billion in Q4 2069/70. They increased by 3.55 times, reaching Rs. 3.84 billion by Q4 2082/83. Borrowings, the institution's core liability, grew at a median annual rate of 17.94%, increasing from Rs. 1.07 billion to Rs. 3.76 billion. Meanwhile, total liabilities and equity combined increased from Rs. 1.20 billion to Rs. 5.69 billion. The major liability trends are discussed below.
1. Borrowings
Borrowings from upper-class BFIs and other institutions increased at a median annual rate of 17.94%. Within total liabilities (excluding equity), borrowings accounted for 99.41% in Q4 2069/70 and remained almost unchanged at 97.70% by Q4 2082/83. This indicates that the institution remains highly dependent on borrowings and may need to diversify its funding sources by utilizing other financial instruments.
2. Other Liabilities
Other liabilities showed a steadily increasing trend throughout the review period. From Q4 2069/70 to Q4 2082/83, they increased significantly from Rs. 60.21 lakh to Rs. 8.84 crore. This category reached its highest level in Q4 2082/83.
3. Total Liabilities
Total liabilities followed a trend similar to borrowings, recording a median annual growth rate of 18.33%. Since borrowings constitute the largest portion of total liabilities, their growth closely mirrored the overall liability trend.
4. Equity Analysis
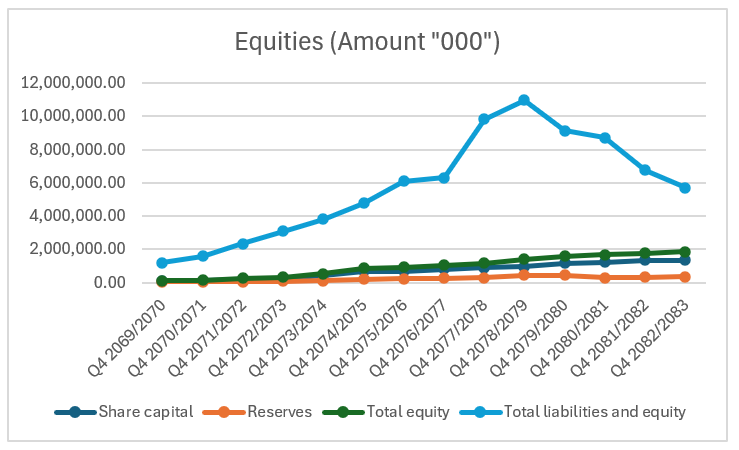
Total equity of FMDBL increased at a median annual growth rate of 12.61%. During the same period, share capital grew at a median annual rate of 10.00%, while reserves increased at a median annual rate of 25.47%.
Profit and Loss Analysis
1. Interest Income and Interest Expense
Interest income and interest expense represent the institution's core revenue-generating activities and the cost of funding those assets, respectively. Interest income declined after reaching its peak of Rs. 1.43 billion in Q4 2079/80. Thereafter, both interest income and interest expense decreased steadily. By Q4 2082/83, interest income had fallen sharply to Rs. 40.47 crore.
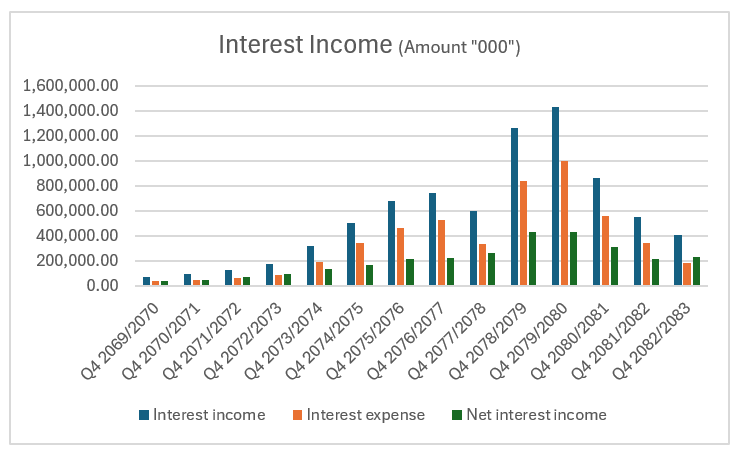
Notably, during the declining interest rate environment, FMDBL reduced its funding costs more rapidly than its lending yields. As a result, the net interest margin did not decline in the same proportion. This was mainly because wholesale microfinance institutions were able to obtain borrowings at relatively lower costs from upper - class BFIs due to excess liquidity in the banking system.
2. Operating Profit and Net Profit
Operating profit reflects the institution's profitability before taxation and provisioning, while net profit represents earnings attributable to shareholders.
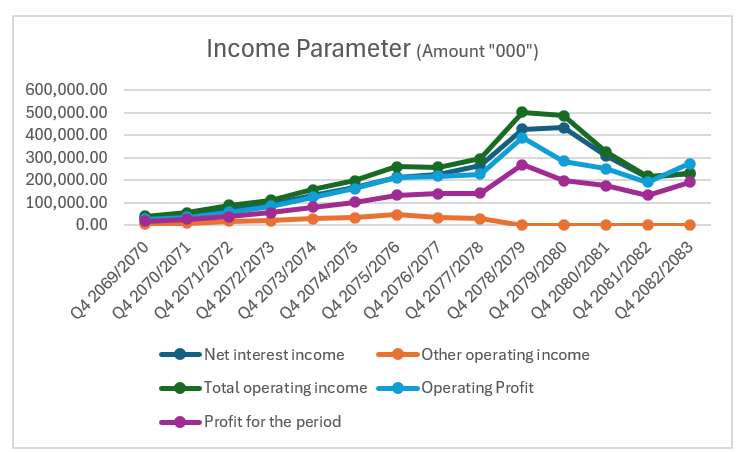
FMDBL recorded its highest-ever net profit of Rs. 26.88 crore in Q4 2078/79. Overall, the institution's net profit has been on a declining trend in recent years.
3. Expenses
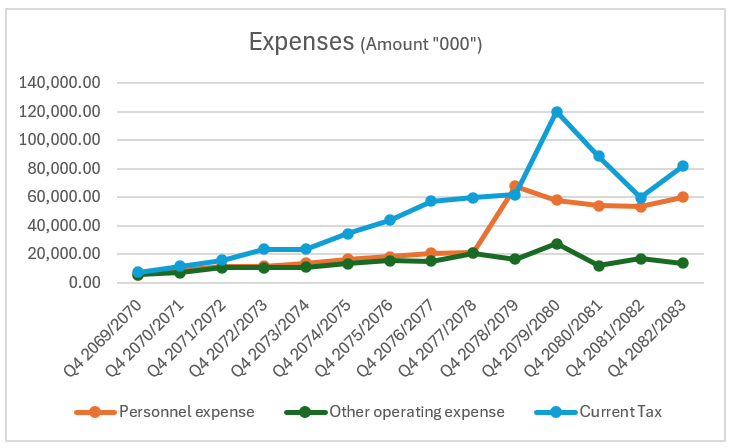
Interest expense remains FMDBL's largest expense and is considered the primary direct cost in the banking industry. This expense has shown a declining trend in line with falling market interest rates. The next major expense is income tax, followed by staff costs. Other operating expenses remained relatively low throughout the review period.
Trends in Key Performance Indicators
Earnings Metrics
Earnings Per Share (EPS)
FMDBL's Earnings Per Share (EPS) has experienced considerable volatility over the past fifteen fiscal years, reflecting changes in profitability and the overall operating environment.
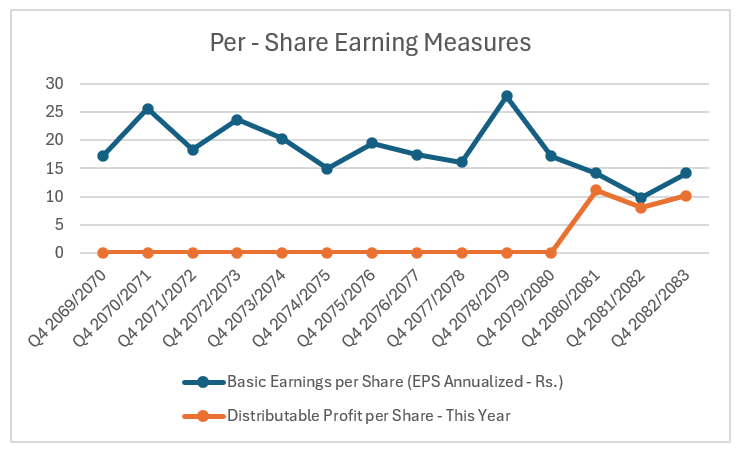
EPS remained relatively stable within the range of Rs. 15 to Rs. 25 up to Q4 2077/78. It peaked at Rs. 27.88 in Q4 2077/78 before declining sharply to Rs. 17.16 in the following year. As of Q4 2082/83, EPS stood at Rs. 14.18.
Efficiency Measures
Return on Equity (RoE)
RoE broadly mirrors the movement in EPS. The ratio declined to 7.79% in Q4 2081/82 due to weak profitability. It rebounded to 10.33% in Q4 2082/83, demonstrating improved utilization of shareholders' capital.
Although current returns remain below their historical peak, FY 2082/83 recorded an RoE of 10.33%, reflecting improved earnings generation from shareholders' equity. The institution still has room to restore a stronger profitability profile.
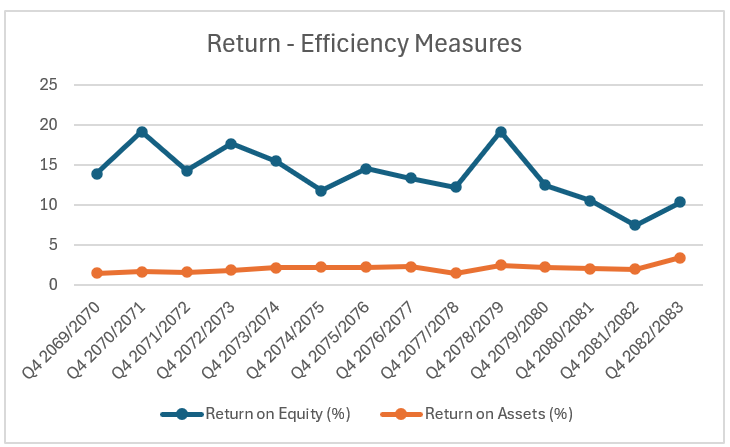
Return on Assets (RoA)
RoA followed a similar trajectory to RoE. During the review period, it was lowest at 1.42% in Q4 2069/70 and reached its highest level of 3.35% in Q4 2082/83. Following a decline until around Q4 2077/78, the ratio recovered steadily. The FY 2082/83 figure of 3.35% represents the highest RoA during the entire review period, indicating improved efficiency in utilizing total assets to generate profits.
Valuation Multiples
Price-to-Earnings (P/E) Ratio and Price-to-Book (P/B) Ratio
FMDBL's P/E ratio has been highly volatile, mainly due to significant fluctuations in its market price. The ratio reached a peak of 84.54 times in Q4 2072/73. Thereafter, it followed a downward trend as the market price declined while earnings remained relatively stable. From Q4 2078/79 onward, the P/E ratio again followed an upward trend. As of Q4 2082/83, it stood at 60.64 times.
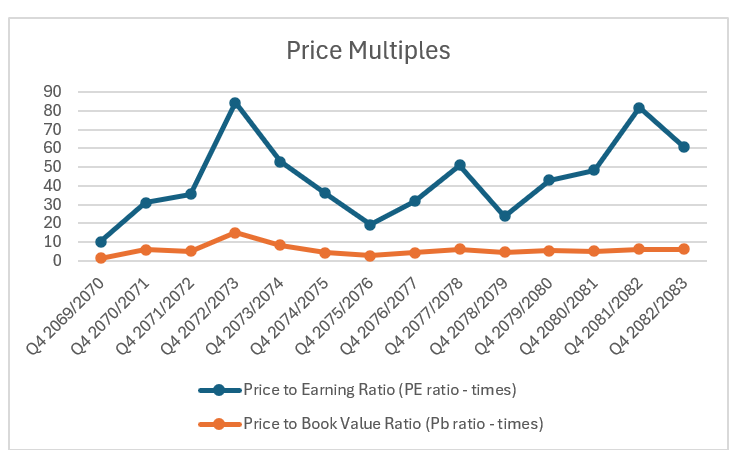
Similarly, the P/B ratio peaked in Q4 2072/73 because of the exceptionally high market price. Thereafter, it consistently remained below 10 times, with a median of 5.30 times over the past 15 years. This indicates that the market price has generally grown faster than the institution's net worth per share. During the review period, FMDBL maintained an average Net Worth Per Share (NWPS) of Rs. 132.88.
Health Indicators
FMDBL has consistently maintained its Capital Fund to Risk-Weighted Assets Ratio (CAR) at a healthy level, demonstrating a strong capital position.
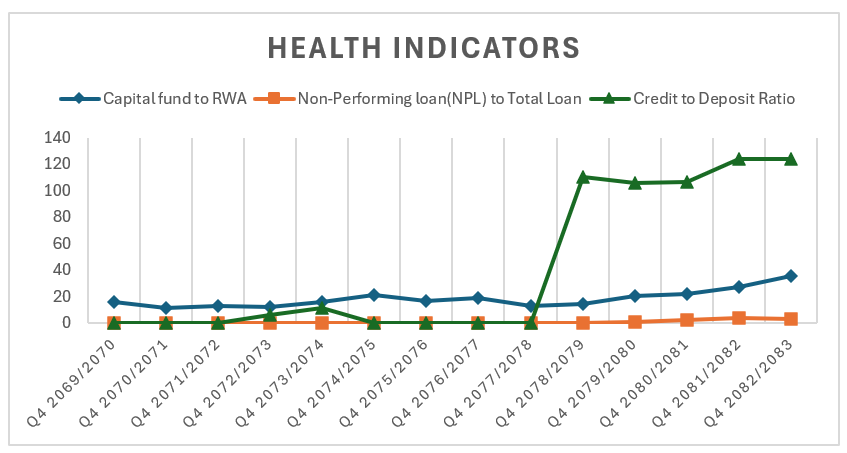
The institution has also maintained an efficient lending position. As of Q4 2082/83, the Credit-to-Deposit (CD) ratio stood at 123.87%. Since Q4 2078/79, the CD ratio has remained above 100%. This is because FMDBL is a wholesale microfinance institution that primarily deals with institutional borrowing and lending rather than retail deposit collection, making such a ratio acceptable for its business model.
Despite being a wholesale microfinance institution, FMDBL's Non-Performing Loan (NPL) ratio has shown an increasing trend. Before Q4 2079/80, the institution reported virtually no NPLs. However, since Q4 2079/80, NPLs have gradually increased. As of Q4 2082/83, the NPL ratio stood at only 2.88% of total loans, mainly reflecting the inability of some retail microfinance institutions to repay wholesale borrowings on time.
Dividend History
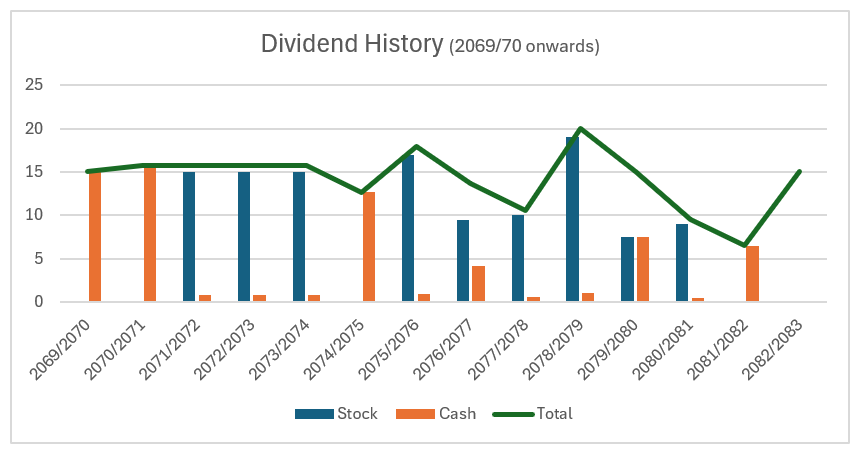
FMDBL has maintained a moderate dividend distribution history. The institution declared its highest dividend of 20.00% in FY 2078/79. Over the review period, FMDBL maintained a median annual total dividend of 15%. Although the dividend payout has been moderate, one positive aspect is that the institution has consistently distributed dividends to its shareholders every year.
Note: This article provides an analysis of FMDBL's financial statements only and does not attempt to draw any conclusions or make any judgments.

