

Why Do Nepal's Commercial Banks Keep Losing to the Market?
Fri, Aug 7, 2026 3:17 PM on Economy, Stock Market, Exclusive,

The fundamentals behind a decade of underperformance
Between 15 July 2017 and 16 July 2026, Nepal's Commercial Banking sub-index rose 1%. Over the same nine years, the broader NEPSE Index rose 64%. Only one other sector on the exchange did worse. That gap is the starting point for this piece: banking is the largest sector on NEPSE by market capitalization, and on paper one of the soundest by average fundamentals, yet it has been among the worst places to make an investment for most of the past decade.
The usual explanations, too much supply, too little speculative interest, are real, but they are not the deeper story. The deeper story is that the sector's capacity to pay dividends has collapsed at the same time as bad loans have quietly climbed, and headline valuation ratios have masked both trends for years.
Graph 1: NEPSE and Its Sectoral Index Growth, 15 July 2017 – 16 July 2026 (FY2016/17 = Base).
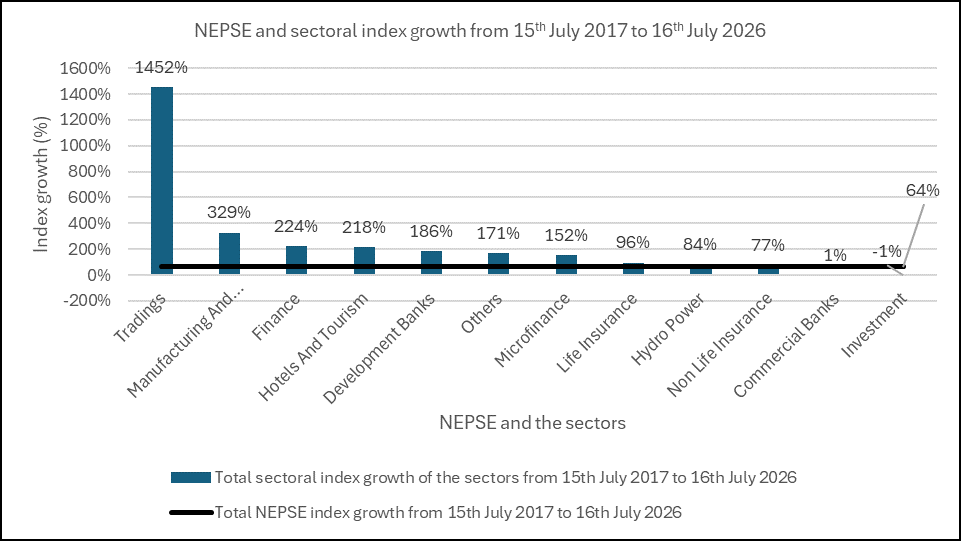
Note: The Microfinance, Life Insurance, Non-Life Insurance, and Investment sector indices began tracking slightly later than the others shown.
Supply Explains Part of the Story
Commercial Banking posted the second-lowest sectoral growth of the period, ahead of only Investment (-1%). At the other extreme, Trading gained 1,452%, followed by Manufacturing and Processing (329%), Finance (224%), and Hotels and Tourism (218%). The pattern is consistent across sectors: low-float stocks have rallied on comparatively modest speculative buying, while high-float sectors have lagged.
Share supply is one of two forces that set a stock's return, alongside its underlying fundamentals. Low-float stocks are easy to move because a small amount of buying makes a huge impact on the free float. Commercial banks sit at the opposite end: their combined paid-up capital exceeded NPR 395 billion by the third quarter of FY2025/26, a scale that makes their share prices far harder to shift on sentiment alone. That leaves fundamentals, rather than trading dynamics, as the real determinant of where bank share prices go next.
Yet most long-term retail investors in Nepal concentrate their holdings in banking stocks, drawn by their perceived stability and dividend history. Many have noticed that even years of holding these shares have produced minimal or negative returns, a trend that has sharpened over the last five years.
Graph 2: NEPSE Index Growth vs. Commercial Banking Index Growth, FY2016/17–FY2025/26 (Cumulative, Base FY2016/17).
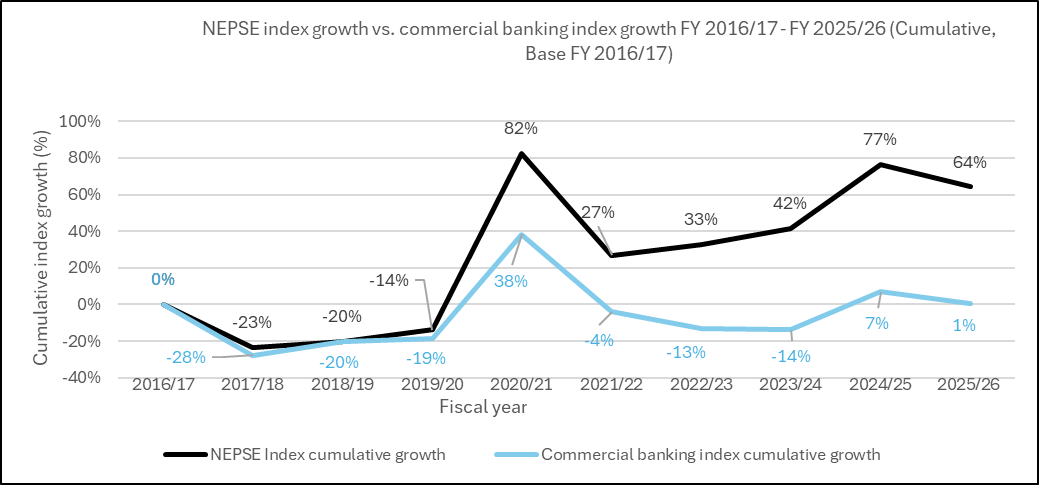
The two indices fell together through the FY 2017/18–FY 2019/20 correction, with banking falling faster (-28% vs. NEPSE's -23% by FY2017/18). They diverged from FY2020/21, when NEPSE surged 82% on the post-pandemic reopening rally while banking rose just 38%. NEPSE kept climbing to 42% cumulative growth by FY2023/24; banking, that same year, turned negative at -14%. It crossed back into positive territory in FY2024/25 (7%) before drifting down to 1% by FY2025/26, even as NEPSE stood 64% above its base. For three consecutive fiscal years, banking moved backward while the broader market advanced.
The Real Culprit: Falling Dividend Capacity, Rising Bad Loans
Oversupply explains why banking hasn't rallied as hard as low-float sectors. It doesn't explain why banking has gone backward in absolute terms. That requires looking at what banks can actually afford to pay out, and what's sitting on their books.
Graph 3: Commercial Banking Sector, Average Dividend-Paying Capacity per Share vs. NPL Ratio, FY2016/17–FY2025/26 Q3.
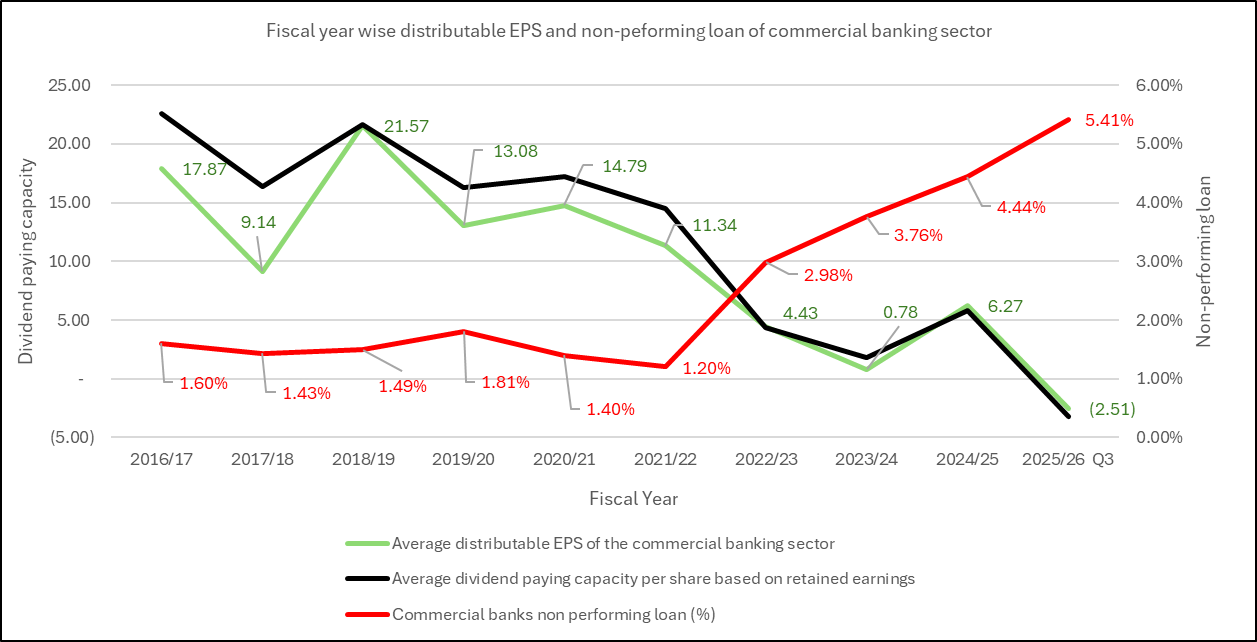
Note: FY2025/26 Q3 distributable EPS is drawn from banks' published financial statements; earlier years' figures are from historical NEPSE-listed company filings. Retained earnings and distributable EPS differ slightly due to Nepal Rastra Bank (NRB) regulatory adjustments.
In FY2016/17, average dividend-paying capacity across the sector stood at NPR 17.87 per share, against an average non-performing loan (NPL) ratio of 1.60%. By FY2023/24, dividend-paying capacity had collapsed to NPR 0.78 per share, while NPLs had more than doubled to 3.76%. The deterioration continued from there: NPLs reached 4.44% in FY2024/25 and 5.41% by the third quarter of FY2025/26, more than three times the FY2016/17 level. Dividend-paying capacity recovered briefly to NPR 6.27 per share in FY2024/25, then turned negative, roughly NPR -2.51 per share, in the most recent quarter, implying that loan-loss provisioning has, on average, outpaced retained earnings.
Throughout this period, banks traded at price-to-earnings ratios of 15 to 20, which on the surface looked undervalued relative to the broader market. That apparent cheapness masked real strain underneath. Even after FY2021/22, when economic growth slowed and NPLs should mechanically have climbed, reported sector-wide NPLs stayed surprisingly low, at just 1.20% that year. By comparison, IMF research on past systemic banking crises finds that a large majority exhibit NPL ratios exceeding 7% of total loans at their peak, with Asian-crisis-era peaks running considerably higher still.
Nepal's sector-wide figure has still not approached even the lower end of that historical range five years on, which raises a fair question: how much of the gap reflects genuinely resilient underwriting, and how much reflects accounting or regulatory flexibility in how bad loans get classified and provisioned?
This is the part that most retail investors, and, by some accounts, even professional fund managers, appear to have missed. Many continued holding banking stocks with visibly shrinking dividend capacity and deteriorating loan books, because headline ratios like P/E, P/B, and reported EPS growth still looked reasonable in isolation.
The Exceptions Prove the Rule
Not every bank fits the pattern. Among the 19 commercial banks listed on NEPSE, Everest Bank (EBL), Standard Chartered Bank Nepal (SCB), and Sanima Bank (SANIMA) have meaningfully outperformed peers. As of the third quarter of FY2025/26, they reported NPL ratios of 0.61%, 1.81%, and 3.99%, respectively, all comfortably below the sector average of 5.41%. What sets them apart is not their float or their trading volume; it's stronger dividend-paying capacity and materially lower NPLs than the industry average. Investors in most other commercial banks, by comparison, have seen negligible or negative returns over the same period.
The Takeaway
P/E, P/B, and EPS growth remain useful screening tools, but on their own they are not sufficient for long-term investment decisions in Nepal's banking sector; they can look reasonable even while dividend capacity is collapsing underneath them. Until dividend-paying capacity recovers sector-wide, and non-performing loans and non-banking assets come down meaningfully, a broad recovery in banking share prices looks unlikely, regardless of how attractive individual valuation metrics appear in isolation.
For investors positioned in the sector, two figures are worth tracking each quarter going forward: the sector-wide NPL ratio in NRB's quarterly bank supervision reports, and distributable EPS in each bank's unaudited quarterly financials. A sustained reversal in both, not a single good quarter, would be the signal that the sector's decade-long underperformance is finally turning. Until then, selectivity among individual banks, not blanket exposure to the sector, is likely to remain the more rewarding approach for investors in Nepal's banking stocks.
Article By: Dipendra Pandey

