

Weekly technical Analysis of NEPSE index; know the market trend, support and resistance for next week
Fri, Sep 21, 2018 6:13 PM on Featured, Stock Market, Technical Analysis, Weekly Analysis,
This week’s Index movement: Stock’s were traded for 4 days this week. On the first trading day (Sunday) the index was up by 11.69 points. On Monday index lost 0.15 points; on Tuesday the index had gained 2.41 points. On the last trading day (Thursday) the index lost 3.74 points. Index has formed four consecutive bullish candles on weekly basis. The index had gained 10.81 points this week.
Technical Analysis
Candlestick Pattern: On daily and weekly candlestick special pattern was not observed. The small bodied candle has formed on the daily basis and Monday’s candle was the dozi which supports the short-term trend reversal.
Exponential Moving Average (EMA): We have used two EMA’s of time period 20 days (red line) and 5 days (blue line).
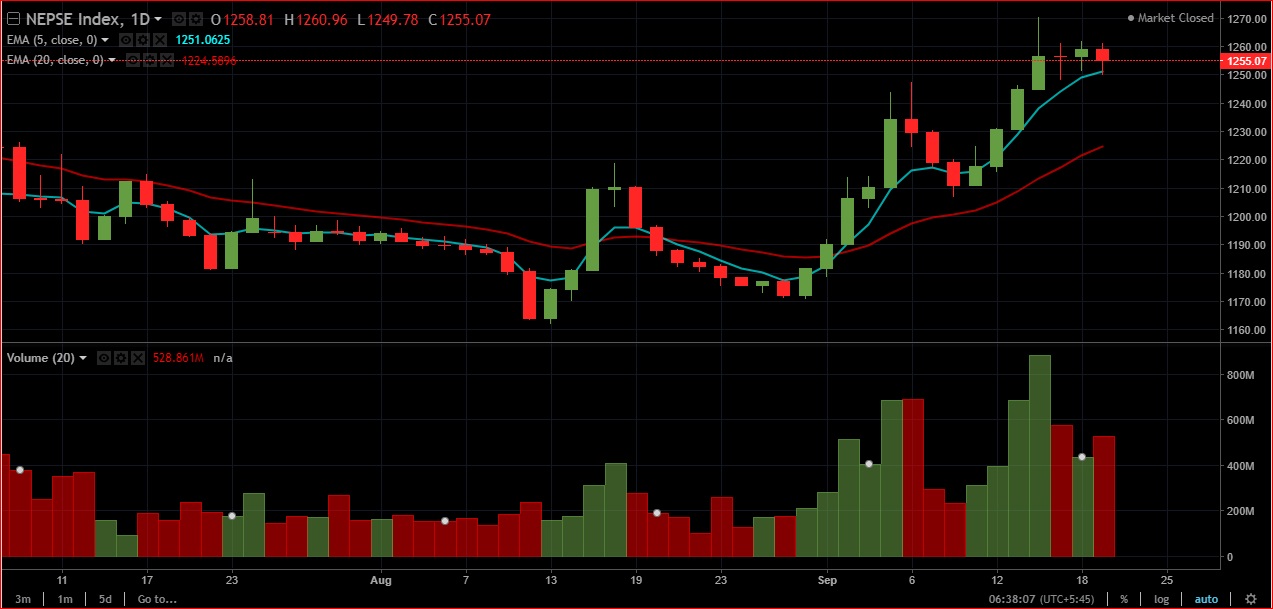
 (EMA’s and volume chart taken from the SS Pro )
The short and mid-term trend is looking very positive from the picture above as both the EMA's are below the NEPSE value and the distance between the 5 days and 20 days EMA's has increased. The long term trend is still bearish as 180 days EMA is at around 1300 points.
Volume: From volume chart, strong signal was not observed.
Bollinger Bands: Index is trading near the upper band of the Bollinger bands which indicates the slowdown of volatility and supports the reversal.

(RSI and Bollinger Bands taken from the SS Pro )
RSI: The RSI had touched the over-bought position of 70 and has started to reverse. There is a divergence but it has not confirmed yet as you can observe in the picture the index was sideways but the RSI has moved downward. RSI is currently at the 68 points.
MACD: MACD is positive and currently it is at 16 points which shows the positive sentiments of the investors.

(Picture is taken from the SS Pro)
Market confidance on Thurday was 44.50 and confidance has decreased from 47.20 comparing to last Thursay's market confidance.

Market confidance is supporting the slugish market.
Conclusion:NEPSE index is making higher highs day after another so we can say that the market is looking very positive but the speed of the current trend could slow down and the formation of small bodied candle provides a support for the sideways market.
Predications: Sideways market
Support and Resistance level according to Pivot Points
Pivot Point: 1256 points
1st Resistance: 1268 points 2nd Resistance: 1281 points
1st Support: 1243 points 2nd Support: 1230 points
This week’s market statistics:
Index Open: 1244.84 points Index Closed: 1255.07 points
High: 1270.19 points Low: 1244.84 points
Total Turnover: Rs 2.62 arba
Total Transaction: 27700
Total Traded Shares: 90.70 lakhs
