With the second quarter report of major BFIs being published, investors are keen to know the financial performance of these institutions. Among the 37 listed development banks (B-categorized), there are 11 national level development banks in the country. Two banks such as Tourism Development Bank Limited merged with MEGA Bank Limited and NIDC Bank Limited merged with Rastriya Banijya Bank Limited.
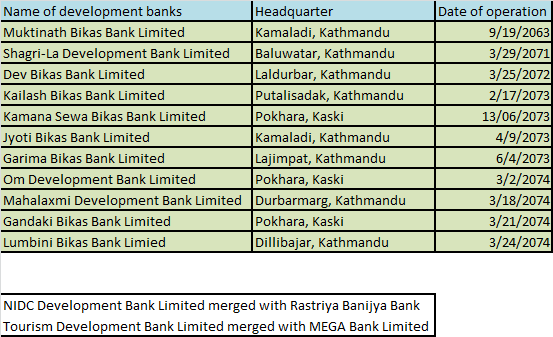
Among all these national level development banks, five major banks such as Gandaki Bikas Bank Limited (GDBL), Garima Bikas Bank Limited (GBBL), Om Development Bank Limited (ODBL), Muktinath Bikas Bank Limited (MNBBL) and Deva Bikas Bank Limited (DBBL) have already published their financial statements for second quarter of FY 2074/75. Thus, the article aims to provide a comparative analysis on the performance of these five banks.
Gandaki Bikas Bank has been operating with it’s headquarter in Pokhara, Kaski. Similarly, Garima Bikas Bank Limited started its operation with it’s headquarter in Lazimpat, Kathmandu. Om Development Bank Limited has been operating with it’s headquarter in Pokhara, Kaski. Deva Bikas Bank Limited (DBBL) emerged after the successful merger between NDEP Development Bank and Rising Development Bank Limited and started its joint venture on 10
th July, 2015.
The financial indicators of these companies show MNBBL as the clear winner in terms of net profit, paid up capital, deposit collection and loan & advances for the second quarter of FY 2074/75. However, looking at the other side of the story, GDBL is leading with highest annualized EPS, lowest P/E ratio and finally highest reserves and surplus. Among the mentioned banks, GDBL and DBBL have not met the paid up capital requirement of Rs 2.50 arba.
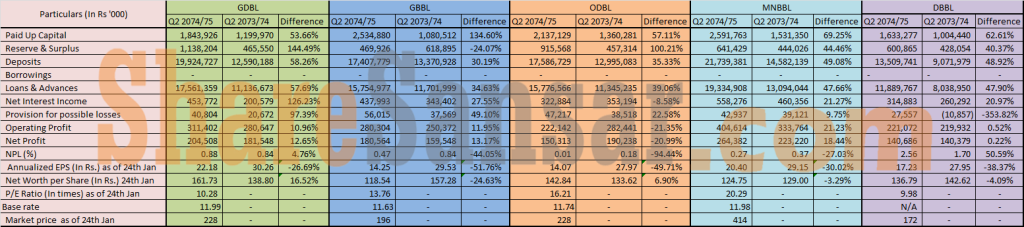 (Please feel free to download and study the table in case of difficulty upon reading the image.)
GDBL has maintained it’s paid up capital of Rs 1.84 arba, GBBL of Rs 2.53 arba, ODBL of Rs 2.13 arba, MNBBL of Rs 2.59 arba and finally, DBBL with a paid up capital of Rs 1.63 arba. GDBL has maintained highest reserve and surplus of Rs 1.13 arba, with ODBL in second position (Rs 91.55 crore), MNBBL in third position (Rs 64.14 crore) followed by DBBL (Rs 60.08 crore) and finally, GBBL with least reserve and surplus of Rs 46.99 crore.
As of Q2 of FY 2074/75, the net profit of MNBBL is highest (i.e. Rs 26.43 crore). The bank with least net profit is DBBL (i.e., Rs 14.06 crore). The bank that saw comparatively higher decline in net profit is ODBL which is by 20% low as compared to the second quarter of the FY 2073/74. GBBL has been able to increase its profit from Rs 15.9 crore (Q2 of FY 2073/74) to Rs 18.05 crore (Q2 of FY 2074/75). On the other hand, in terms of deposit collection and loan, GDBL has expanded its portfolio by 58% and 57% respectively which is the largest among the five banks. However, it is still lagging behind MNBBL for the second quarter of FY 2074/75. MNBBL has the highest deposit of Rs 21.73 arba and credit portfolio of Rs 19.33 arba.
With GDBL’s growing portfolio, the bank has also increased its provision of possible losses by a whopping 97.39% as compared to the second quarter of last fiscal year. This indicator has stood as a major limitation of the concerned bank. However, among the five banks, DBBL’s provision for possible losses is the least which stands at Rs 2.75 crore.
Considering the provided facts, the bank with leading annualized EPS is GDBL (i.e. Rs 22.18). Within the period of second quarter of FY 2073/74 to the second quarter of this fiscal year, the bank has declined its EPS straight from Rs 30.26 to Rs 22.18. The second highest EPS among these five banks is Rs 20.40. It belongs to MNBBL. The bank also observed decrease in its EPS from Rs 29.15 to Rs 20.40. Considering the almost similar EPS of these two banks, the P/E ratio of these banks has a significant difference. GDBL has a comparatively lower P/E ratio i.e. 10.28 while MNBBL has a P/E ratio of 20.29 times.
Among two banks such as GBBL and ODBL, the EPS stands at Rs 14.25 and Rs 14.07 respectively. However, the P/E ratios of these banks differ by approximately 3 points. For instance, GBBL has a P/E ratio of 13.76 times while ODBL has a P/E ratio of 16.21 times. Although similar EPS and yet, lower P/E ratio, GBBL was traded on 24
th January at Rs 196 while ODBL was traded at a higher price i.e. Rs 228. Finally, although higher EPS (i.e. Rs 17.23) and lower P/E ratio (i.e. 9.98) compared to GBBL and ODBL, the LTP of DDBL stood at only Rs 172 on 24
th Jan, 2018.
The following table provides an insight on the bank’s operational efficiency.
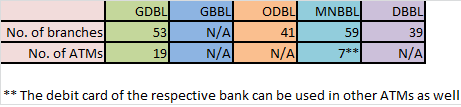
Hence, the provided figures show the financial status as per the second quarter of FY 2074/75 of the five national level development banks in the country. What say do you have on their performance? Which bank do you think will do better in the near future? Please feel free to leave your opinions in the comment section.
(Disclaimer: Any kind of information that is provided in the article should not be used as a sole advice or recommendation by investors in order to design their investment portfolio. So, before taking steps for any kind of the information, the investors are required to base their judgment on their own financial analysis, appropriateness of the information and seek independent financial advice. The information of the company has been taken from the authorized sources such as website of the company, NEPSE, financial reports and press releases of the companies so, any changes not updated in these may differ in the analysis.)


