

Mutual Fund Schemes performance with respect to NEPSE Index- with reference to NIBL Mutual Fund Schemes
Wed, Aug 5, 2020 12:21 PM on Mutual Fund, Stock Market, Latest,

In order to evaluate mutual fund scheme volatility with respect to NEPSE index volatility, we have taken NIBL Ace Capital’s Mutual Fund Schemes performance for the last 2 fiscal years FY2075/76 and FY2076/77.
NIBL Ace Capital currently has three Mutual Fund Schemes. At the moment, NIBL Mutual Fund has two Close Ended Schemes; NIBL Samriddhi Fund –1 (NIBSF-1) and NIBL Pragati Fund (NIBLPF) and one Open Ended Scheme; NIBL Sahabhagita Fund (NIBLSF). NIBLSF is the first open-ended mutual fund scheme in Nepal after implementation of the Mutual Fund Regulation, 2067 and Mutual Fund Guidelines, 2069 issued by SEBON and the trading is facilitated by the fund manager through various distribution outlets.
Fiscal Year 2075/76
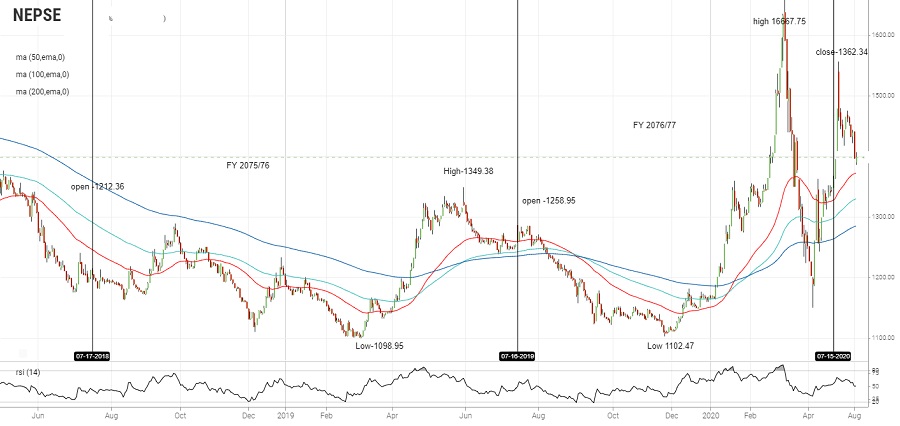
In the FY 2075/76 NEPSE index opened at 1212.36 and tested low of 1098.95 on 5th March 2019 and bounced back to test high of 1349.38 on 30th May 2019. We have compared the volatility of index from open to low, low to high, and open to close with respect to the volatility of NAV of the schemes at the respective index level.
|
Open to Low |
|||
|---|---|---|---|
|
Scheme |
2075 Shrawan Beginning |
2075 Falgun End |
% Growth |
|
NIBSF1 NAV |
11.29 |
10.08 |
-0.09% |
|
NIBLPF NAV |
7.81 |
7.59 |
-2.82% |
|
NEPSE |
1212.36 |
1098.95 (5th March 2019) |
-9.35% |
* 12% Dividend Adjustment Done While Calculating NAV Growth of NIBSF1
After opening at 1212.36 NEPSE tested low of 1098.95 in intraday on 5th March 2019 and declined by 9.35% with respect to opening index level. Considering the NAV of NIBLPF and NIBS1 at the opening of FY 2075/76 and NAV of the month where NEPSE index hit low, NIBL PF declined by 2.82% and NIBSF1 declined by 0.09% which was less than the decline rate of a benchmark index.
|
Low to High |
|||
|---|---|---|---|
|
Scheme |
2075 Falgun End |
2076 Jestha End |
% Growth |
|
NIBSF1 NAV |
10.08 |
10.75 |
6.65% |
|
NIBLPF NAV |
7.59 |
8.34 |
9.88% |
|
NEPSE |
1098.95 |
1349.38 (30th May 2019) |
22.79% |
After testing a low of 1098.95 NEPSE bounced upward to test a high of 1349.38 with a rise of 22.79% in the benchmark index. Taking NAV of both schemes with respect to low and high index level, NIBL PF increased by 9.88%, and NIBSF1 increased by 6.65%.
|
Open to Close |
|||
|---|---|---|---|
|
Scheme |
2075 Shrawan Beginning |
2076 Ashad End NAV |
% Growth |
|
NIBSF1 NAV |
11.29 |
10.69 |
5.31% |
|
NIBLPF NAV |
7.81 |
8.28 |
6.02% |
|
NIBLSF NAV |
- |
9.96 |
- |
|
NEPSE |
1212.36 |
1259.01 |
3.85% |
* 12% Dividend Adjustment Done While Calculating NAV Growth of NIBSF1.
Considering the open and close of the NEPSE during the FY 2075/76, the NEPSE index increased by 3.85% whereas NIBSF1 and NIBL PF increased by 5.31% and 6.02% respectively.
Nepse chart
Fiscal Year 2076/77
In the FY 2076/77 NEPSE index opened at 1258.95 and tested low of 1102.47 on 25th NOV 2019 and bounced back to test high of 1667.75 on 1st March 2020. We have compared the volatility of index from open to low, low to high, and open to close with respect to the volatility of NAV of the schemes at the respective index level during the FY 2076/77.
|
Open to Low |
|||
|---|---|---|---|
|
Scheme |
2076 Shrawan Beginning |
2076 Mangsir End |
% Growth |
|
NIBSF1 NAV |
10.69 |
9.67 |
-3.46% |
|
NIBLPF NAV |
8.28 |
7.87 |
-4.95% |
|
NIBLSF NAV |
9.96 |
10.16 |
2.01% |
|
NEPSE |
1258.95 |
1102.47(25th Nov 2019) |
-12.43% |
* 6.5% Dividend Adjustment Done While Calculating NAV Growth of NIBSF1
Considering the opening of the index level of FY 2076/77 with respect to low, NEPSE declined by 12.43%. Considering the NAV of the schemes with respective opening and low of NEPSE Index, NIBLPF declined by only 4.95%, NIBSF1 declined by 3.46% whereas NIBLSF (Sahabhagita fund) increased by 2.01%. This shows the schemes reacted less compared to NEPSE in a downward trend.
Low to High:
|
Low to High |
|||
|---|---|---|---|
|
Scheme |
2076 Mangsir End |
2076 Falgun End |
% Growth |
|
NIBSF1 NAV |
9.67 |
11.44 |
18.30% |
|
NIBLPF NAV |
7.87 |
9.73 |
23.63% |
|
NIBLSF NAV |
10.16 |
10.62 |
4.53% |
|
NEPSE |
1102.47 |
1667.75 (1st March 2020) |
51.27% |
After testing a low of 1102.47 NEPSE bounced upward to test high of 1667.35 with a rise of 51.27% in the benchmark index. Taking monthly NAV of both schemes with respect to low and high index level, NIBL PF increased by 23.63%, NIBSF1 increased by 18.30%, and NIBLSF increased by 4.53%.
Open to Close:
|
Scheme |
2076 Shrawan Beginning |
2077 Ashad End |
% Growth |
|---|---|---|---|
|
NIBSF1 NAV |
10.69 |
11.6 |
14.59% |
|
NIBLPF NAV |
8.28 |
9.86 |
19.08% |
|
NIBLSF NAV |
9.96 |
11.07 |
11.14% |
|
NEPSE |
1258.95 |
1362.34 |
8.21% |
* 6.5% Dividend Adjustment Done While Calculating NAV Growth of NIBSF1
Considering the opening of the index level of FY 2076/77 with respect to the close of the FY, NEPSE increased by 8.21%. Similarly, considering the monthly NAV of the schemes with respective opening and close of NEPSE Index in the FY 2076/77, NIBLPF increased by only 19.08%, NIBSF1 increased by 14.59% and NIBL Sahabhagita fund increased by 11.14%.
Reviewing the 2 years’ data of volatility of NEPSE index and monthly NAV of mutual fund at respective index level, mutual fund schemes’ of NIBL have been less reactive to the NEPSE index in a downward trend compared to a benchmark index.
*Monthly NAV of the schemes at respective index level has been taken for the calculation.
