

Last week before Dashain NESPE rises by 19.60 points; Need to wait till NEPSE moves above 20 EMA and 78.6% Fibonacci Level for bullish confirmation
Fri, Oct 4, 2019 8:08 PM on NEPSE News, Weekly Analysis, Latest,
This week NEPSE Index gained 19.6 Points (1.73%). The Index opened at 1129.80 points and closed at 1149.40 points. On Sunday the index was down by 4.66 points, on Monday index gained 10.42 points, on Tuesday also index gain 10.13 points to sit at 1145.69, on Wednesday index lost 4.98 points and on last trading day before Dashain index gained by 8.69 points.

Candlestick pattern:
Three green and two red small body candlesticks was formed.
Exponential Moving Average:
We have used EMA's of 5 days' time period (blue line), 20 days' time period (red line). At present, NEPSE Index is above 5 days EMA but below 20 days EMA. Short-term averages respond quickly to changes in the price of the underlying, while long-term averages are slow to react.
Moving Average Convergence and Divergence:
MACD line (blue) and the signal line (red line) are in negative zone. MACD line rises above the signal line, this indicates a bullish signal, which suggests that the NEPSE index is likely to experience upward momentum.
Fibonacci retracement method:
NEPSE Index is trading below 78.6 % Fibonacci level. Trading below 61.8% indicates weight of bear is more than bull.
This week's market statistics:
Index Open-1129.80 points Index closed-1149.40 points
Index High- 1149.70 points Index low- 1121.09 points
Support and resistance level for next trading week according to Pivot Point.
Pivot Point- 1139 point
1st Resistance-1158 point 1st support-1130 point
2nd Resistance-1167 point 2nd support-1111 point
Conclusion: Need to wait till NEPSE Index moves above its 20 EMA and 78.6% of Fibonacci Level for bullish confirmation.
Weekly Market Summary of NEPSE
More than 43.77 lakhs unit shares of worth Rs 1.10 arba has been traded through 16.83 thousand transactions this week compared to 40.41 lakhs unit of shares of worth Rs 1 arba, last week. The current market capitalization of NEPSE stands at Rs. 1,460,182.88 Million.
| This week | Last week | % Change | |
|---|---|---|---|
| Total Turnover (Rs.) | 1,101,736,880.00 | 1,001,970,877.00 | 9.96% |
| Total Traded Shares | 4,377,471.00 | 4,041,919.00 | 8.30% |
| Total No. of Transactions | 16,839.00 | 23,829.00 | -29.33% |
| Market Cap at (In million Rs) | 1,460,182.88 | 1,435,318.77 | 1.73% |
| Floated Market Cap at (In million Rs) | 527,768.17 | 518,861.01 | 1.72% |
| No of trading days | 5 | 5 |
The turnover has increased by 9.96% this week compared to last week whereas the total number of transaction decreased by 29.33%.
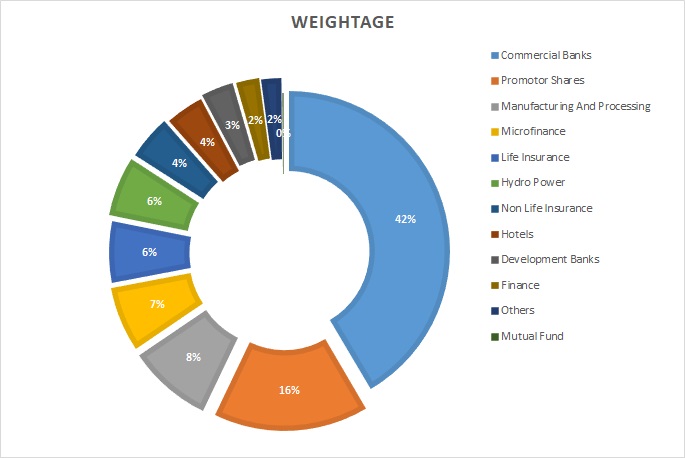
Sector-wise breakdown of the turnover of this week:
The commercial bank sector made 42% of the total turnover this week followed by promoter shares with 16% of the total turnover.
| Sector | This Week (Sept 29-Oct 3) | |
|---|---|---|
| Turnover (Rs in Millions) | Weightage | |
| Commercial Banks | 457.53 | 41.53% |
| Promotor Shares | 171.96 | 15.61% |
| Manufacturing And Processing | 92.75 | 8.42% |
| Microfinance | 71.3 | 6.47% |
| Life Insurance | 67.39 | 6.12% |
| Hydro Power | 65.33 | 5.93% |
| Non Life Insurance | 48.74 | 4.42% |
| Hotels | 41.83 | 3.80% |
| Development Banks | 35.73 | 3.24% |
| Finance | 25.54 | 2.32% |
| Others | 22.34 | 2.03% |
| Mutual Fund | 1.29 | 0.12% |
NEPSE index and Sub-indices performance: (Increment here is based on the previous week closed value)
The NEPSE index increased by 1.73%. Majority of the indices rises this week. Top gainer sector of this week is Hydropower Sector with the rise of 2.54%. 
Top looser of the week is Hotels sector which decline by 1.10%.
| Index | This Week | Last Week | Point Change | % Change Index |
|---|---|---|---|---|
| NEPSE | 1,149.40 | 1,129.80 | 19.60 | 1.73% |
| Sensitive | 251.97 | 247.32 | 4.65 | 1.88% |
| Float | 85.01 | 83.57 | 1.44 | 1.72% |
| Sensitive Float | 80.74 | 79.43 | 1.31 | 1.65% |
| Banking | 1,056.54 | 1,036.77 | 19.77 | 1.91% |
| Development Bank | 1,560.60 | 1,538.71 | 21.89 | 1.42% |
| Finance | 570.83 | 562.96 | 7.87 | 1.40% |
| Hotels | 1,844.31 | 1,864.85 | -20.54 | -1.10% |
| HydroPower | 944.69 | 921.32 | 23.37 | 2.54% |
| Life Insu | 5,053.87 | 4,992.43 | 61.44 | 1.23% |
| Manu. And Processing | 2,443.62 | 2,413.55 | 30.07 | 1.25% |
| Microfinance | 1,476.20 | 1,449.12 | 27.08 | 1.87% |
| Mutual Fund | 9.39 | 9.36 | 0.03 | 0.32% |
| Non Life Insu | 4,256.07 | 4,213.44 | 42.63 | 1.01% |
| Others | 652.34 | 640.41 | 11.93 | 1.86% |
Stock with the highest monthly Beta value from the Banking &Finance Sector
The table below shows the list:
| SN | Stock Symbol | LTP | Monthly Beta | Sector |
|---|---|---|---|---|
| 1 | SAPDBL | 130 | 4.38 | Development Bank |
| 2 | TMDBL | 151 | 3.57 | Development Bank |
| 3 | GLBSL | 437 | 3.41 | Microfinance |
| 4 | KADBL | 171 | 2.78 | Development Bank |
| 5 | SPARS | 545 | 2.33 | Microfinance |
| 6 | NNLB | 435 | 2.1 | Microfinance |
| 7 | SLBSL | 680 | 2.02 | Microfinance |
| 8 | MSMBS | 469 | 1.99 | Microfinance |
| 9 | MSLB | 954 | 1.98 | Microfinance |
| 10 | GILB | 710 | 1.88 | Microfinance |
Saptakoshi Development Bank Limited (SAPDBL) has the highest monthly Beta value of 4.38 followed by Tinau Mission Development Bank (TMDBL) with 3.57 beta value.

All the analysis are done with the SS Pro Software. To know more about the software click on the link below
Top Ten Gainers of the week:
Unilever Nepal Limited (UNL) is the top gainer of the week. UNL closed at Rs 20,185 with Rs 1,835 (10%) increment.
| S.N. | Symbol | Open Price (Rs.) | Closing Price (Rs.) | Change (Rs.) | Change (%) |
|---|---|---|---|---|---|
| 1 | UNL | 18,350.00 | 20,185.00 | 1,835.00 | 10 |
| 2 | UNHPL | 51 | 56 | 5 | 9.8 |
| 3 | CEFL | 104 | 112 | 8 | 7.69 |
| 4 | SHPC | 183 | 197 | 14 | 7.65 |
| 5 | JOSHI | 54 | 58 | 4 | 7.41 |
| 6 | CZBILP | 140 | 150 | 10 | 7.14 |
| 7 | UFL | 173 | 185 | 12 | 6.94 |
| 8 | SPDL | 72 | 77 | 5 | 6.94 |
| 9 | BOKLPO | 150 | 160 | 10 | 6.67 |
| 10 | PICL | 422 | 450 | 28 | 6.64 |
Top Ten Losers of the week:
Multipurpose Finance Limited (MPFL) price has decreased by 5.83% and its LTP stands at Rs 97.
| S.N. | Symbol | Open Price (Rs.) | Closing Price (Rs.) | Change (Rs.) | Change (%) |
|---|---|---|---|---|---|
| 1 | MPFL | 103 | 97 | -6 | -5.83 |
| 2 | HURJA | 112 | 106 | -6 | -5.36 |
| 3 | SHIVM | 542 | 513 | -29 | -5.35 |
| 4 | OHL | 518 | 494 | -24 | -4.63 |
| 5 | LEMF | 6.84 | 6.58 | -0.26 | -3.8 |
| 6 | UMHL | 105 | 102 | -3 | -2.86 |
| 7 | MLBBL | 450 | 438 | -12 | -2.67 |
| 8 | NLG | 578 | 563 | -15 | -2.6 |
| 9 | CMF1 | 9.29 | 9.05 | -0.24 | -2.58 |
| 10 | CLBSL | 476 | 466 | -10 | -2.1 |
Top Stocks by Turnover and Number of Transaction:
Shivam Cements Limited (SHIVM) has the highest turnover for the week. More than Rs 7.85 crore worth of SHIVM shares were traded this week.
| S.N. | Top Turnover | Top No of Transaction | ||
|---|---|---|---|---|
| Symbol | Turnover (Rs.) | Symbol | Trans (No) | |
| 1 | SHIVM | 78,537,416 | SHIVM | 1,093 |
| 2 | NBBPO | 70,125,000 | RHPL | 1,091 |
| 3 | PRVU | 65,962,105 | SJCL | 974 |
| 4 | SBL | 45,303,209 | UPPER | 552 |
| 5 | BOKLPO | 42,864,160 | SBL | 519 |
| 6 | SANIMA | 40,021,162 | SANIMA | 492 |
| 7 | NIBPO | 34,180,200 | BOKL | 461 |
| 8 | SHL | 33,746,789 | NLIC | 399 |
| 9 | NLIC | 33,171,986 | PRVU | 357 |
| 10 | BOKL | 32,978,047 | MEGA | 315 |
Top Buyers Brokers of the Week:
Primo Securities Pvt. Limited (Broker No- 16) was the top Buyer broker of this week and it has bought stocks of worth Rs 6.52 crores.
| S.N. | Broker No. | Broker Name | Buy Amount (Rs.) |
|---|---|---|---|
| 1 | 16 | Primo Securities Pvt. Limited | 65,285,244.00 |
| 2 | 49 | Online Securities Pvt.Ltd | 61,439,663.00 |
| 3 | 45 | Imperial Securities Co .Pvt.Limited | 60,868,180.00 |
| 4 | 25 | Sweta Securities Pvt. Limited | 56,475,295.00 |
| 5 | 17 | ABC Securities Pvt. Limited | 56,474,843.23 |
| 6 | 44 | Dynamic Money Managers Securities | 50,642,228.00 |
| 7 | 29 | Trishul Securities And Investment | 47,822,011.00 |
| 8 | 32 | Premier Securites Company Limited | 44,977,830.00 |
| 9 | 14 | Nepal Stock House Pvt. Limited | 43,957,813.00 |
| 10 | 39 | Sumeru Securities Pvt.Limited | 40,267,593.00 |
Top Seller Broker of the Week:
Agrawal Securities Pvt. Limited. (Broker No- 6) is the top seller broker for this week. The brokerage firm has sold stocks of worth Rs 8.30 crores.
| S.N. | Broker No. | Broker Name | Sell Amount (Rs.) |
|---|---|---|---|
| 1 | 6 | Agrawal Securities Pvt. Limited | 83,091,669.00 |
| 2 | 45 | Imperial Securities Co .Pvt.Limited | 72,426,899.00 |
| 3 | 42 | Sani Securities Company Limited | 59,773,950.40 |
| 4 | 25 | Sweta Securities Pvt. Limited | 54,997,393.00 |
| 5 | 48 | Trishakti Securities Public Limited | 52,131,424.00 |
| 6 | 29 | Trishul Securities And Investment | 44,754,986.00 |
| 7 | 17 | ABC Securities Pvt. Limited | 42,284,568.23 |
| 8 | 44 | Dynamic Money Managers Securities | 42,187,941.00 |
| 9 | 32 | Premier Securites Company Limited | 38,422,219.40 |
| 10 | 58 | Naasa Securities Co. Ltd. | 35,942,715.00 |
Top 10 Market Capitalization Companies:
| S. No. | Symbol | Capitalization (Rs. In Million) |
|---|---|---|
| 1 | NTC | 95550 |
| 2 | NABIL | 69246.91 |
| 3 | NIB | 57141.68 |
| 4 | SCB | 46466.3 |
| 5 | EBL | 46154.47 |
| 6 | HBL | 43112.49 |
| 7 | NLIC | 42320.44 |
| 8 | NICA | 37801.66 |
| 9 | ADBL | 37504.6 |
| 10 | NMB | 36741.38 |
All the analysis are done with the SS Pro Software. To know more about the software click on the link below
