At present there are 23 National level Development Banks being traded in Nepse.
| Name of Development bank |
Paid up Capital (000) In Rs
|
Reserve and Surplus (000) In Rs
|
| NIDC |
415,823.40 |
2,700,043.46 |
| KBBL |
1,110,201.00 |
487,027.00 |
| MNBBL |
838,432.75 |
392,800.87 |
| ODBL |
1,052,849.50 |
389,969.85 |
| FBBL |
995,000.00 |
354,292.00 |
| REDBL |
738,393.00 |
345,116.00 |
| ACEDBL |
1,000,402.00 |
311,115.00 |
| SDBL |
715,950.00 |
302,879.00 |
| GBBL |
853200.00 |
272610.00 |
| BUDBL |
1,056,200.00 |
273,548.00 |
| DBBL |
818,095.00 |
260,489.00 |
| SUPRME |
811,622.00 |
205,691.00 |
| TBBL |
820,015.00 |
202,334.00 |
| IDBL |
940,907.00 |
199,212.00 |
| TDBL |
786,944.00 |
193,318.00 |
| KDBL |
679,897.00 |
180,240.00 |
| JBBL |
923,476.00 |
164,029.00 |
| INDBL |
770,880.00 |
133,414.00 |
| INDB |
290,500.00 |
73,484.26 |
| SODBL |
897,930.20 |
41,532.70 |
| APEX |
666,563.20 |
-35,222.00 |
| YETI |
1,386,233.00 |
-129,802.00 |
| VBBL |
917,074.00 |
-138,226.00 |
| Average |
847,242.96 |
312,169.35 |
Paid-up capital is the amount of money a company has received from shareholders in exchange for shares of stock.
National Level Development Banks must meet a paid up capital requirement of 2.50 arba by the end of the Fiscal Year 2073/74.
The average paid up capital and Reserve of National level development bank stand at Rs 84.72 crore and Rs 31.21 crore respectively. NIDC Development Bank Limited (NIDC) has the highest reserve out of all National level development bank. The development bank covers 39.09% of the total reserve of all the national level development banks. Reserve of the NIDC development bank stands at Rs 2.70 arba.
Kailash Bikas Bank Limited (KBBL) has the highest paid up capital among all the national level development banks. Its paid up capital stands at Rs 1.11 arba.
Apex Development Bank (APEX), Yeti Development Bank (YETI) and Vibhor Bikas bank (VBBL) have its reserve in negative in the third quarter of the ongoing fiscal year.
| Name of Development bank |
Deposits (in ‘000) In Rs
|
Loan and Advances (in ‘000) In Rs.
|
| ODBL |
10,930,290.78 |
8,995,077.63 |
| FBBL |
10,631,626.00 |
9,336,986.00 |
| KBBL |
10,564,048.00 |
9,335,663.00 |
| MNBBL |
9,846,866.09 |
8,607,573.08 |
| YETI |
9,273,054.00 |
8,032,851.00 |
| TBBL |
8,429,565.00 |
6,226,787.00 |
| SDBL |
8,344,527.00 |
7,174,463.00 |
| GBBL |
7,844,953.00 |
7,168,278.00 |
| TDBL |
7,521,983.00 |
6,301,969.00 |
| JBBL |
7,489,602.00 |
5,969,607.00 |
| ACEDBL |
7,412,668.00 |
6,535,993.00 |
| REDBL |
7,394,293.00 |
6,537,198.00 |
| SUPRME |
7,341,132.00 |
5,478,446.00 |
| DBBL |
7,313,886.00 |
6,490,273.00 |
| APEX |
6,759,054.63 |
5,620,878.62 |
| BUDBL |
6,516,889.00 |
6,097,436.00 |
| SODBL |
6,475,327.15 |
5,428,003.84 |
| KDBL |
6,405,803.00 |
5,264,992.00 |
| VBBL |
5,944,376.00 |
5,019,343.00 |
| INDBL |
5,406,051.00 |
4,633,509.00 |
| IDBL |
5,083,614.00 |
4,320,393.00 |
| INDB |
2,195,349.81 |
1,758,001.19 |
| NIDC |
1,592,104.42 |
2,048,179.10 |
| Average |
7,248,567.95 |
6,190,517.41 |
In the third quarter of Fiscal Year 2072/73, the average deposit collection and loan dispersion of development bank stands at Rs 7.24 arba and 6.19 arba respectively. Om Development Bank Limited (ODBL), Fewa Bikas Bank Limited (FEWA) and Kailash Bikas Bank Limited (KBBL) have high deposit collection and loan mobilization compared to other national level development banks. The reason behind the expansion of business of these development banks is their successful merger with other Banks and financial institution.
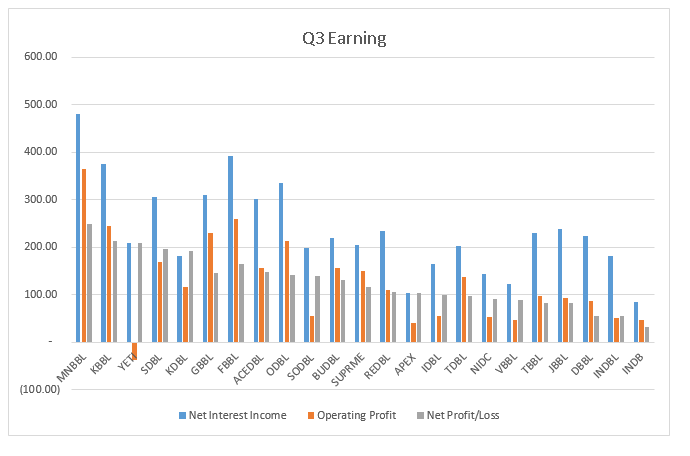
In terms of net profit, Muktinath Bikas Bank Limited (MNBBL) has the highest net profit out of all the national level development banks in the third quarter of the ongoing fiscal year. After MNBBL, stands KBBL with the second highest net profit.Yeti Development Bank has the third highest net profit in Q3 of FY 2072/73. The main reason of increment in net profit of development banks is due to write back.
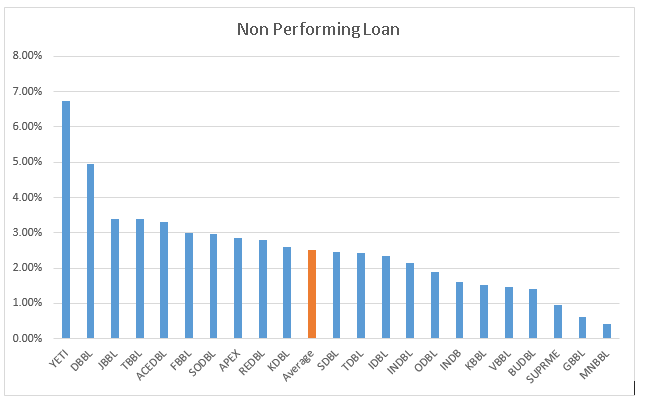
The average non-performing loan (NPL) of development banks stand at 2.60%. Non-performing loan of NIDC is not included while calculating the average non-performing loan of National Level Development Banks as it has a very high non-performing loan. Its non-performing loan is at 20.46%.
Out of 23 National Level Development Bank, 10 development bank has non-performing loan above average, whereas 12 development bank has a non-performing loan below average. Supreme Development Bank Limited (SUPRME)and MNBBL have lowest non-performing loans and it stands below 1 percent. In the third quarter this fiscal year, the non-performing loan of many development banks have declined.
| Name of Development bank |
Net-worth per Share (Rs.) |
Earning Per Share annualized (Rs.) |
| MNBBL |
146.85 |
39.49 |
| KDBL |
126.51 |
37.88 |
| SDBL |
142.30 |
36.55 |
| NIDC |
749.32 |
29.00 |
| KBBL |
143.87 |
25.56 |
| GBBL |
131.95 |
22.92 |
| FBBL |
135.61 |
22.09 |
| APEX |
94.72 |
20.82 |
| SODBL |
104.63 |
20.74 |
| YETI |
90.64 |
20.18 |
| ACEDBL |
131.10 |
19.68 |
| REDBL |
146.74 |
19.12 |
| SUPRME |
125.34 |
19.01 |
| ODBL |
137.04 |
17.86 |
| TDBL |
124.47 |
16.68 |
| BUDBL |
125.90 |
16.65 |
| INDB |
125.30 |
15.21 |
| IDBL |
121.17 |
14.12 |
| TBBL |
124.67 |
13.64 |
| VBBL |
84.93 |
12.89 |
| JBBL |
117.76 |
11.85 |
| INDBL |
117.31 |
9.69 |
| DBBL |
131.84 |
9.13 |
| Average |
151.30 |
20.47 |
The average net worth per share and Earning per Share of National Level Development Banks stands at Rs 152.30 and Rs. 20.47. MNBBL has the highest net worth per share and highest earnings per share. Net worth per share and Earning per share of MNBBL stands at Rs 146.85 and Rs 39.49 respectively.


