
Know in details about the all-time favorite company traded in NEPSE, Citizen Investment Trust
Thu, Jul 9, 2020 7:50 AM on Company Analysis, Financial Analysis, Stock Market,
Citizen Investment Trust (CIT)
Sector: Others
Symbol: CIT
No. of shares outstanding: 16,407,410
Introduction
Citizen Investment Trust was registered under the Citizen Investment Trust Act 2047 on March-18, 1991. Its formal operation started on January-15, 1992. The Head office is located at New Baneshwor, Kathmandu, and the branch office are at Pokhara and Biratnagar. It is a government-owned financial organization which operates and manages various types of retirement schemes/programs as well as various unit schemes and mutual fund program for both domestic and foreign investors. It has successfully completed is two-decade challenging years.

|
Board of Directors |
|
|---|---|
|
Name |
Position |
|
Prof. Dr. Ram Chandra Bhattarai |
Chairman |
|
Mr. Raman Nepal |
Member (Executive Director) |
|
Mr. Yagya Prasad Dhungel |
Member |
|
Dr. Ram Sharan Kharel |
Member |
|
Mr. Chandra Singh Saud |
Member |
|
Mr. Kamlesh Kumar Agrawal |
Member |
|
Mr. Kabi Prasad Pathak |
Member |
|
Mr. Laxmi Prasad Paudel |
Member |
|
Mr. Ashok Budhathoki |
Member |
|
Schemes and Interest rates |
|
|---|---|
|
Schemes |
Interest Rate (%) |
|
Investors A/C scheme/Gratuity Fund Scheme |
As per income |
|
Citizen Unit Scheme (Corporate) |
8.0% |
|
Citizen Unit Scheme (Individual) |
8.0% |
|
Insurance Fund (Nepal Police) |
6.5% |
|
Insurance Fund (Armed Police Force) |
6.5% |
|
Insurance Fund (Nepalese Army) |
6.5% |
|
Insurance Fund (NARC) |
6.5% |
|
Insurance Fund (Teachers) |
6.5% |
|
Insurance Fund (Civil Service) |
6.5% |
|
Easy Loan/Education Loan |
10.0% |
|
Home Loan |
9.5% |
|
ESG Retirement Fund (80% Loan) |
9.0% |
|
ESG Retirement Fund (Deposit) |
7.5% |
(Source: https://nlk.org.np/interest-schemes)
Financial Ratios and Other Information’s:
|
Particulars |
2071/2072 |
2072/2073 |
2073/2074 |
2074/2075 |
2075/2076 |
|---|---|---|---|---|---|
|
Total Paid-up capital (In lakhs) |
6,075.00 |
7,402.65 |
9,031.23 |
9,031.23 |
12,678.65 |
|
Reserve & Surplus (In lakhs) |
3,574.31 |
3,413.26 |
5,457.55 |
8,740.97 |
17,680.02 |
|
Total Income (In lakhs) |
4,868.98 |
4,954.00 |
5,951.09 |
7,136.59 |
8,432.99 |
|
Total Expenditure (In lakhs) |
1,648.17 |
1,687.00 |
1,957.71 |
2,250.50 |
2,281.21 |
|
Net profit after tax (In lakhs) |
1,861.46 |
2,372.22 |
2,923.93 |
3,583.97 |
4,622.84 |
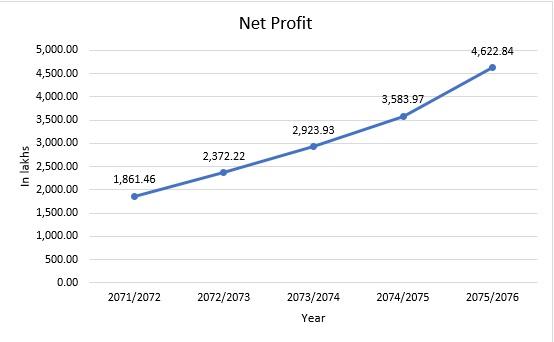
The company has been able to increase its total income consistently at a compounded annual growth rate of 11.61%. The company’s ability to manage its expenditure has led them to retain a fair amount of profit for the company. The company has also been able to increase the value for its shareholders by increasing the Reserves in the 5-year period at a compounded annual growth rate of 37.68%.
Overall Turnover (including Schemes):
|
Year |
2071/2072 |
2072/2073 |
2073/2074 |
2074/2075 |
2075/2076 |
|---|---|---|---|---|---|
|
Total Income (In lakhs) |
41,967.48 |
44,929.72 |
42,403.90 |
67,737.71 |
97,988.10 |
|
Total Expenditure (In Lakhs) |
35,767.05 |
45,117.82 |
50,885.95 |
60,492.37 |
74,850.10 |
Investments (In Lakhs):
|
Fiscal Year |
2071/2072 |
2072/2073 |
2073/2074 |
2074/2075 |
2075/2076 |
CAGR (%) |
|---|---|---|---|---|---|---|
|
Investments |
468,564.30 |
650,730.82 |
752,043.66 |
882,028.68 |
1,018,636.68 |
16.80% |
|
E.S.G.R.S |
306,856.05 |
447,501.26 |
460,313.30 |
571,541.00 |
702,698.43 |
18.02% |
|
Central |
1,460.98 |
1,460.98 |
1,461.27 |
1,503.96 |
5,301.68 |
29.41% |
|
Unit Schemes |
13,060.99 |
19,850.80 |
16,754.36 |
10,798.50 |
11,993.01 |
-1.69% |
|
Gratuity Fund Scheme |
78,901.12 |
87,981.12 |
144,501.96 |
134,601.96 |
175,832.71 |
17.38% |
|
Investor's Account Scheme |
20,226.98 |
71,871.22 |
97,412.22 |
122,412.22 |
83,231.70 |
32.70% |
|
Insurance Fund Scheme |
48,058.18 |
71,871.22 |
91,412.22 |
122,412.22 |
83,570.16 |
11.70% |

CIT has made remarkable progress in investments with an annual growth rate of 16.80%. The highest investment is in the E.S.G.R.S which has covered 66% of total investments with an annual growth rate of 18.02% whereas Central has the lowest coverage. Similarly, Gratuity Fund has covered investment of 17% which has grown at an annual rate of 17.38%, Insurance Fund Scheme with the total coverage of 10%, Investors Account Scheme with total coverage of 4% and Unit scheme with 3% which has a negative CAGR at -1.69%.
Size of the Fund Managed (In lakhs):
|
Fiscal Year |
2071/2072 |
2072/2073 |
2073/2074 |
2074/2075 |
2075/2076 |
CAGR (%) |
|---|---|---|---|---|---|---|
|
Size of the fund managed |
678,501.21 |
822,791.15 |
972,296.90 |
1,117,351.07 |
1,239,118.58 |
12.80% |
|
E.S.G.R.S |
445,955.81 |
547,233.51 |
648,516.72 |
765,186.38 |
884,666.13 |
14.68% |
|
Unit Schemes 2052 |
15,545.78 |
23,975.01 |
15,119.65 |
10,988.63 |
9,381.86 |
-9.61% |
|
Gratuity Fund Scheme |
111,117.36 |
127,624.03 |
160,984.04 |
169,819.57 |
196,352.74 |
12.06% |
|
Investor's Account Scheme |
28,494.58 |
29,837.34 |
34,308.31 |
41,365.68 |
47,527.85 |
10.77% |
|
Insurance Fund Scheme |
77,387.58 |
94,121.27 |
113,368.19 |
129,990.81 |
101,090.85 |
5.49% |
Key Indicators:
|
Particulars |
2071/2072 |
2072/2073 |
2073/2074 |
2074/2075 |
2075/2076 |
|---|---|---|---|---|---|
|
Earnings per share (Rs.) |
30.64 |
32.05 |
32.38 |
39.68 |
36.46 |
|
Net worth per share (Rs.) |
158.83 |
159.61 |
337.21 |
278.14 |
239.44 |
|
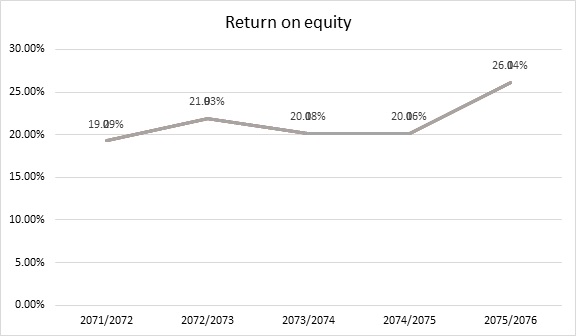
Return on Equity (%) |
19.29% |
21.93% |
20.18% |
20.16% |
26.14% |
|
Return on E.S.G.R.S (%) |
6.50% |
6.50% |
6.50% |
7.50% |
7.50% |
|
Return on Unit Holders (%) |
8.00% |
8.00% |
7.00% |
8.00% |
8.00% |
|
Return on Gratuity Fund (%) |
4.75% |
4.00% |
5.00% |
7.00% |
7.00% |
|
Return on Investor's Accounts Schemes (%) |
4.75% |
4.00% |
5.00% |
7.00% |
7.00% |
|
Net Profit Margin (%) |
32.23% |
47.88% |
49.13% |
50.21% |
54.81% |

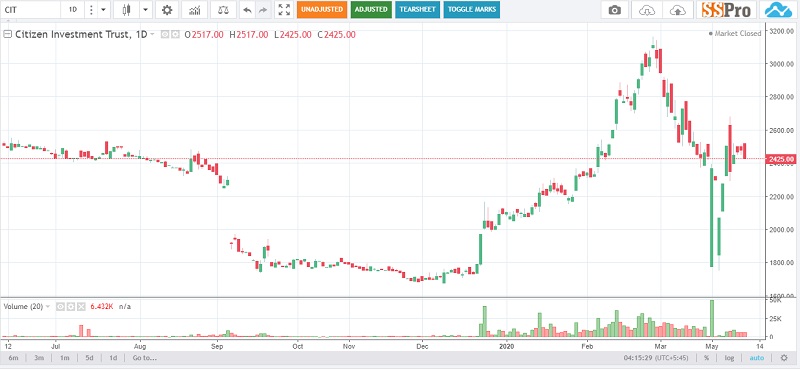
Price History:
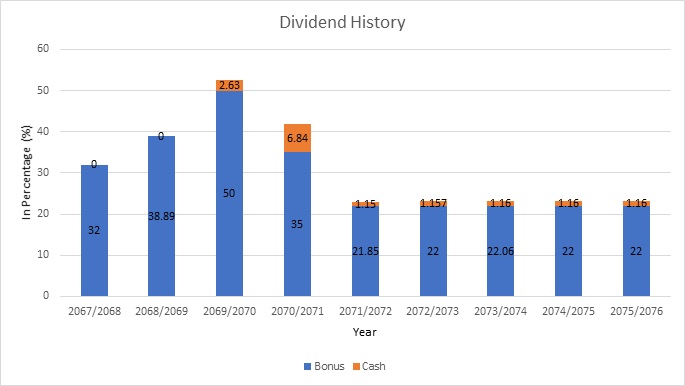
Dividend History:
Some Financials/Price related Information taken from SSPro:

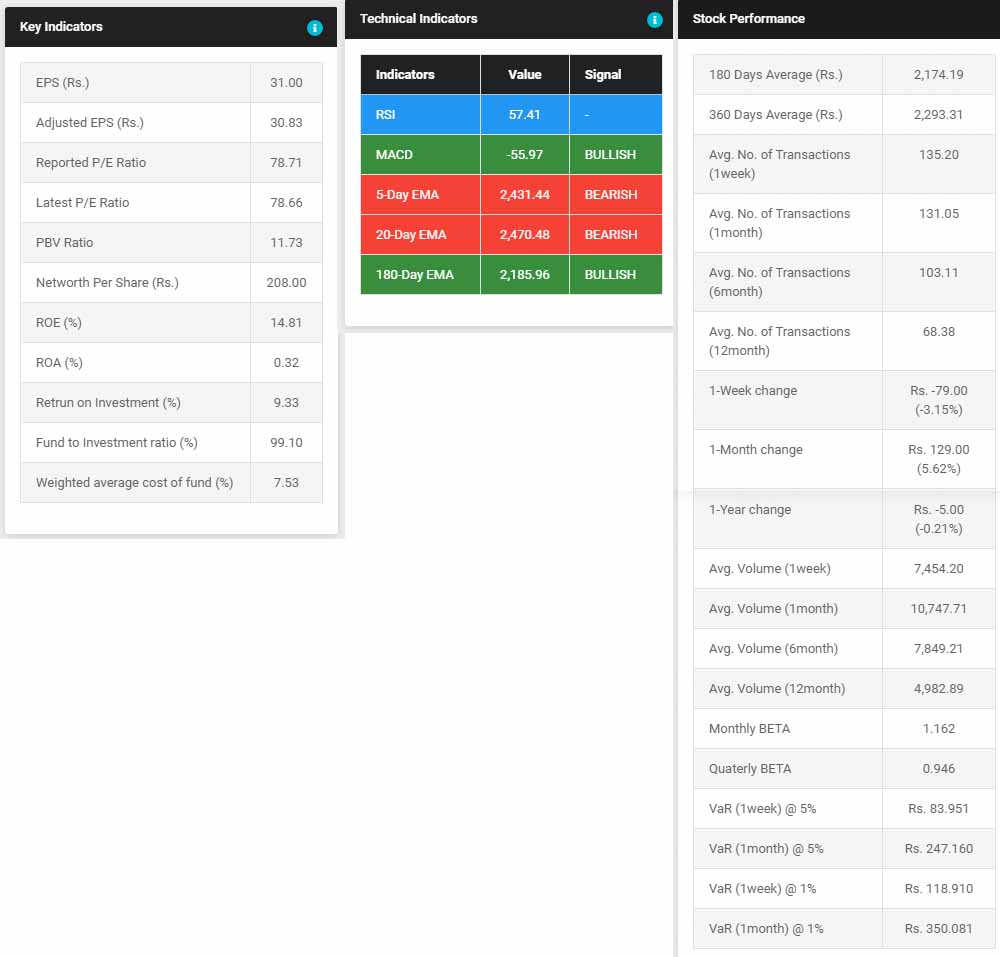
Provided various schemes with an attractive interest rate, the company has been very much profitable than before and also showing the sign of higher growth in the years to come.
The share price is arguable with the per-share earnings of the company since the share price doesn’t seem to justify the earnings of the company. The earning yield is very much low (1.53%) when bought at the current market price which for most investors is nor compelling. The Graham number also seems to show the overvaluation of the stock.
However, the company has been able to show the efficiency to its shareholders which have attracted other investors as well and they are also willing to pay the premium for the stock which pays handsome bonus shares and has a strong fundamental.
Prajwal Shrestha
