

Himalayan Distillery Limited (HDL): A Nine - Year Financial Performance Review (Q4 2074/75 - Q4 2082/83)
Sun, Aug 16, 2026 11:29 PM on Financial Analysis, SS Pro, Exclusive, Latest,
.png)
Himalayan Distillery Limited (HDL) was established in 1985 AD. According to company, it has focused on research, development, manufacturing, and marketing of quality alcoholic beverages in a responsible and professional manner. The company stated that it emphasizes continuous improvement and professionalism in its operations. It further explained that the company was founded with the vision of establishing a distinctive distillery capable of offering a wide range of high-quality alcoholic products manufactured using advanced technology and processes.
The company was initially focused on selling high alcohol content whisky. However, it has now been aggressively expanding its product portfolio, ranging from highly processed premium whisky to low-alcohol beverages and soft drinks. In the coming years, the company’s brands could become more popular among consumers compared with the present context. Here, we examine the company’s performance over the past nine years based on the fourth quarter of each fiscal year, from Q4 2073/74 to Q4 2082/83).
Balance Sheet
Assets
1. Total Non - Current Assets
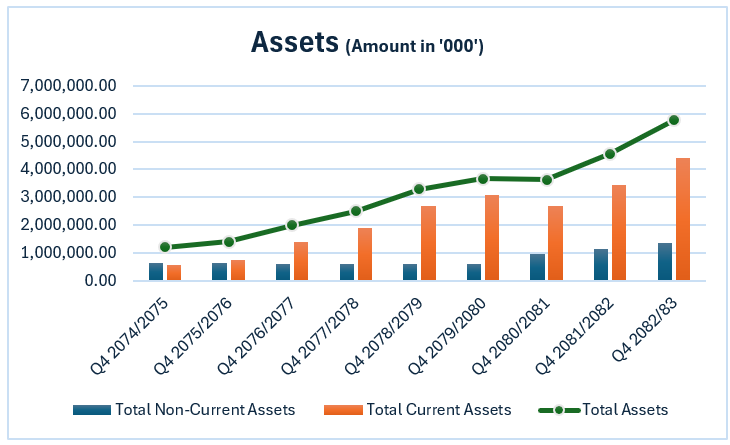
Total non-current assets remained relatively stable during the initial years, declining from Rs. 645.52 million in Q4 2074/75 to Rs. 586.77 million in Q4 2078/79. Thereafter, they increased significantly, reaching Rs. 955.27 million in Q4 2080/81 and Rs. 1.35 billion in Q4 2082/83. Overall, non-current assets increased by around 108.5%, mainly supported by growth in property, plant and equipment.
2. Total Current Assets
Current assets recorded strong growth, increasing from Rs. 545.22 million in Q4 2074/75 to Rs. 4.43 billion in Q4 2082/83. Despite some fluctuations, particularly the decline in Q4 2080/81, current assets expanded substantially and became the major contributor to the company's asset growth. Overall, current assets increased by approximately 712% during the period.
3. Total Assets
Total assets increased significantly from Rs. 1.19 billion in Q4 2074/75 to Rs. 5.77 billion in Q4 2082/83, representing growth of around 385%. The increase was primarily driven by the rapid expansion of current assets, along with a significant increase in non-current assets in the latest years.
Liabilities and Equity
1. Total Equity
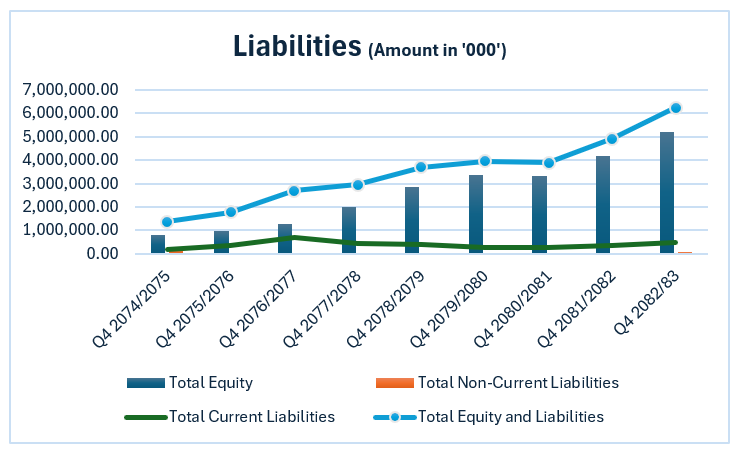
Total equity showed strong growth, increasing from Rs. 794.65 million to Rs. 5.22 billion during the review period. Although equity declined marginally in Q4 2080/81, it recovered strongly thereafter. Overall, equity increased by approximately 556%, reflecting a substantial strengthening of the company's capital base.
2. Total Non - Current Liabilities
Non-current liabilities declined sharply from Rs. 226.22 million in Q4 2074/75 to Rs. 32.29 million in Q4 2075/76 and remained relatively low thereafter. They increased to Rs. 84.81 million in Q4 2082/83, but remained modest compared with the company's equity and total assets.
3. Total Current Liabilities
Current liabilities fluctuated during the period, rising from Rs. 169.88 million in Q4 2074/75 to Rs. 703.10 million in Q4 2076/77, before declining in subsequent years. They stood at Rs. 472.30 million in Q4 2082/83, remaining significantly lower than current assets.
4. Total Equity and Liabilities
Total equity and liabilities increased from Rs. 1.19 billion in Q4 2074/75 to Rs. 5.77 billion in Q4 2082/83, in line with total asset growth. In the latest year, equity accounted for around 90.3% of the total, indicating a strong equity-based capital structure and low dependence on external liabilities.
Profit and Loss
1. Revenue from Sale of Goods
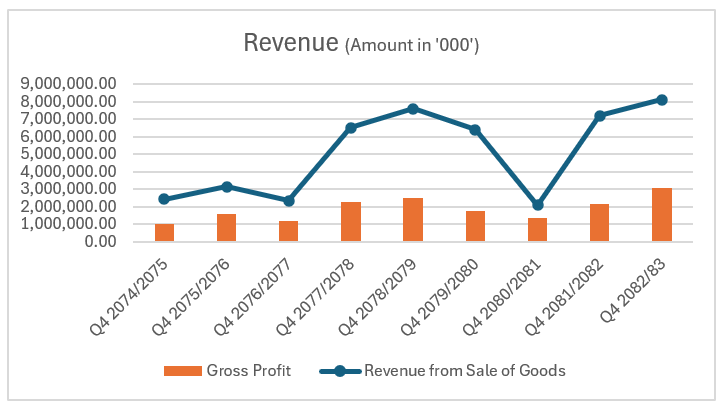
Revenue from sale of goods showed a highly fluctuating but overall upward trend during the review period. Revenue increased from Rs. 2.42 billion in Q4 2074/75 to Rs. 8.11 billion in Q4 2082/83, representing growth of around 235%. It reached a peak of Rs. 7.58 billion in Q4 2078/79 before declining in subsequent years. After a sharp fall to Rs. 2.08 billion in Q4 2080/81, revenue recovered strongly to Rs. 7.20 billion and further to Rs. 8.11 billion in Q4 2082/83, the highest level in the review period.
2. Gross Profit
Gross profit increased from Rs. 998.20 million in Q4 2074/75 to Rs. 3.06 billion in Q4 2082/83. Although it fluctuated during the period, the company recorded strong improvement in the latest year. Gross profit reached Rs. 2.50 billion in Q4 2078/79, declined to Rs. 1.35 billion in Q4 2080/81 and then recovered to Rs. 3.06 billion in Q4 2082/83, indicating improved profitability from core sales.
Operating Expenses
Employee Benefit Expenses
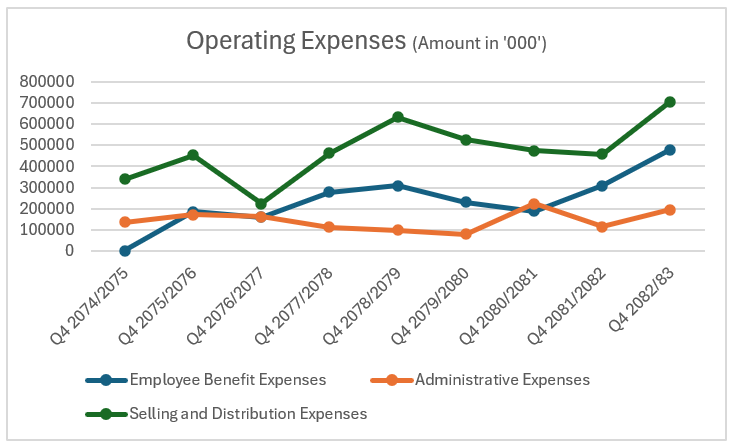
Employee benefit expenses generally increased over the period, rising from Rs. 184.60 million in Q4 2075/76 to Rs. 479.13 million in Q4 2082/83. The expense reached Rs. 308.16 million in Q4 2081/82 before increasing substantially in the latest year. The rise reflects increasing employee-related costs as the company's operations expanded.
Administrative Expenses
Administrative expenses fluctuated throughout the period. They increased from Rs. 135.18 million in Q4 2074/75 to Rs. 171.07 million in Q4 2075/76, before declining to Rs. 79.37 million in Q4 2079/80. The expense increased again to Rs. 195.58 million in Q4 2082/83, indicating higher administrative costs in the latest year.
Selling and Distribution Expenses
Selling and distribution expenses of HDL remained a significant component of operating costs. They increased from Rs. 338.88 million in Q4 2074/75 to Rs. 707.05 million in Q4 2082/83. Although the expense fluctuated over the years, the sharp increase in the latest year was accompanied by strong revenue growth, suggesting higher selling and distribution activities.
Income Measures
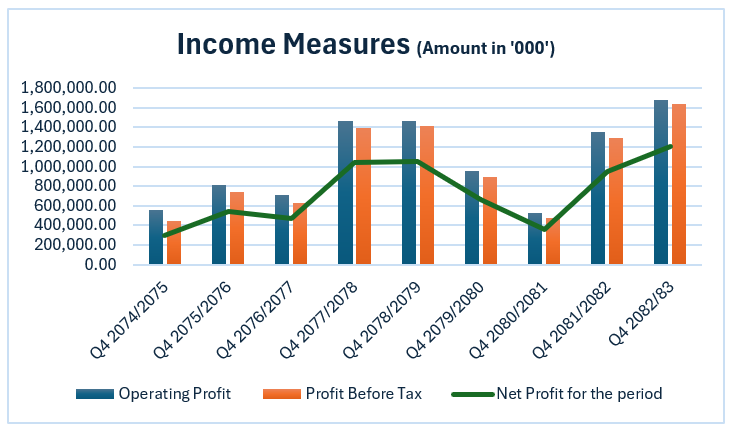
Operating Profit
Operating profit increased from Rs. 552.00 million in Q4 2074/75 to Rs. 1.68 billion in Q4 2082/83. It reached a high of Rs. 1.47 billion in Q4 2078/79 before declining sharply to Rs. 530.38 million in Q4 2080/81. The subsequent recovery to Rs. 1.68 billion represents the strongest operating performance in the review period.
Profit Before Tax
Profit before tax increased from Rs. 440.10 million to Rs. 1.63 billion during the review period. Despite fluctuations, PBT recovered strongly after falling to Rs. 476.76 million in Q4 2080/81. The latest figure of Rs. 1.63 billion in Q4 2082/83 indicates a significant improvement in overall profitability.
Net Profit for the Period
Net profit of HDL increased substantially from Rs. 293.49 million in Q4 2074/75 to Rs. 1.21 billion in Q4 2082/83. It reached Rs. 1.06 billion in Q4 2078/79, declined to Rs. 353.05 million in Q4 2080/81 and then recovered strongly in the following two years. The latest net profit represents the highest level during the review period, reflecting strong recovery in both revenue and operating profitability.
Profit Margins
Gross Profit Margin
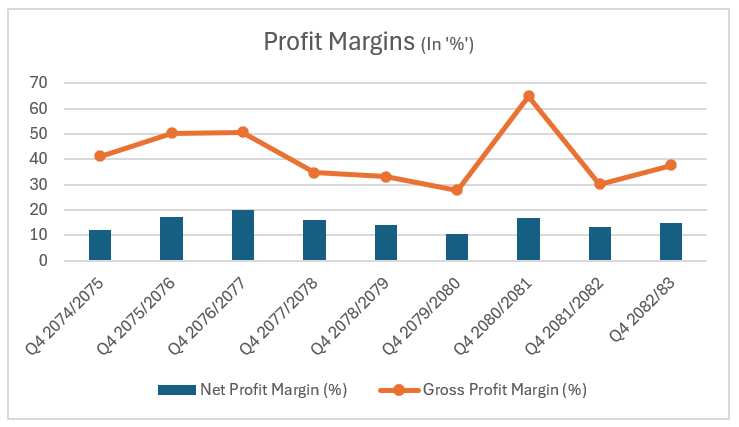
Gross profit margin fluctuated significantly during the review period. It increased from 41.17% in Q4 2074/75 to 50.62% in Q4 2076/77, before declining to 27.78% in Q4 2079/80. It then reached a sharp high of 64.87% in Q4 2080/81, followed by a decline to 30.12% and recovery to 37.70% in Q4 2082/83. The latest margin indicates an improvement in gross profitability compared with the previous year.
Net Profit Margin
Net profit margin improved from 12.10% in Q4 2074/75 to 19.92% in Q4 2076/77, before declining to 10.33% in Q4 2079/80. It recovered to 16.96% in Q4 2080/81 but again declined to 13.24% in Q4 2081/82. In Q4 2082/83, the margin improved to 14.86%, indicating a moderate recovery in the company's overall profitability.
Current Ratio
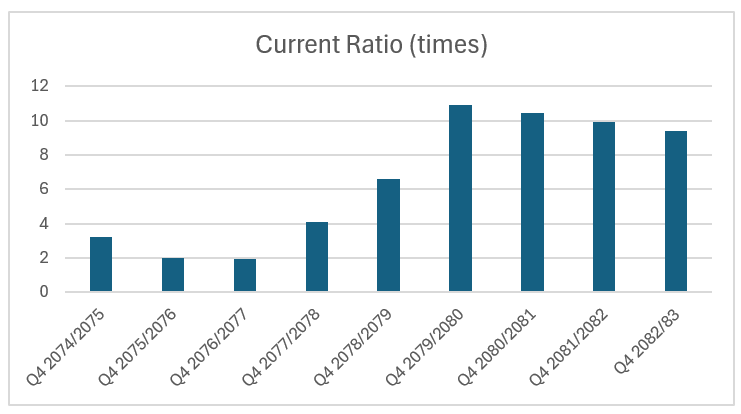
The current ratio remained above 1 time throughout the review period, indicating that current assets were sufficient to cover current liabilities. It increased significantly from 3.21 times in Q4 2074/75 to 10.88 times in Q4 2079/80. Although it gradually declined thereafter, it remained strong at 9.37 times in Q4 2082/83, reflecting a very strong short-term liquidity position.
Per Share Measures
1. Net worth per Share
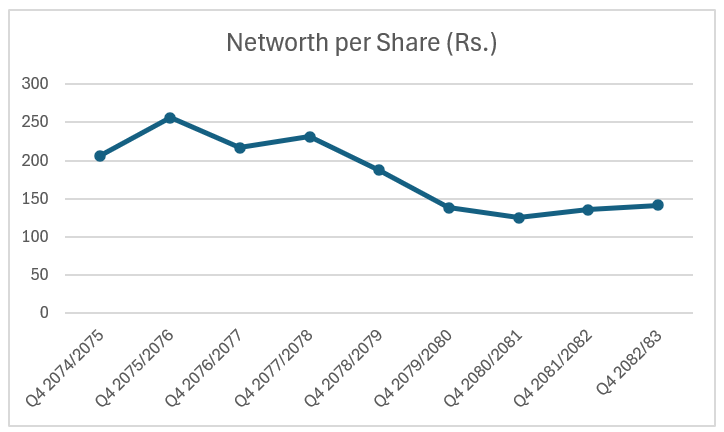
Net worth per share fluctuated throughout the review period. It increased from Rs. 206.06 in Q4 2074/75 to Rs. 256.32 in Q4 2075/76, before declining to Rs. 125.10 in Q4 2080/81. It subsequently recovered to Rs. 141.43 in Q4 2082/83. The recent improvement indicates a gradual strengthening in net worth per share, although it remains below the earlier peak.
2. Earnings per Share
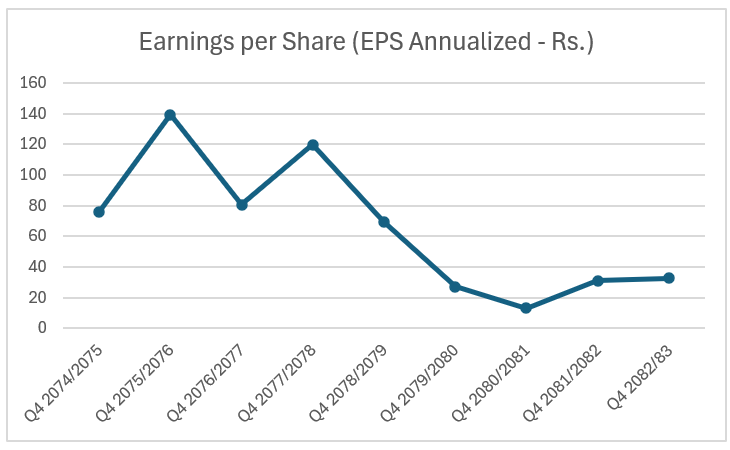
EPS showed considerable fluctuations during the period. It increased from Rs. 76.10 in Q4 2074/75 to a high of Rs. 139.26 in Q4 2075/76, before declining to Rs. 27.17 in Q4 2079/80 and further to Rs. 13.21 in Q4 2080/81. EPS then recovered to Rs. 31.02 in Q4 2081/82 and Rs. 32.71 in Q4 2082/83, indicating an improvement in earnings performance in the latest two years.
Return Efficiency
1. Return on Equity (ROE)
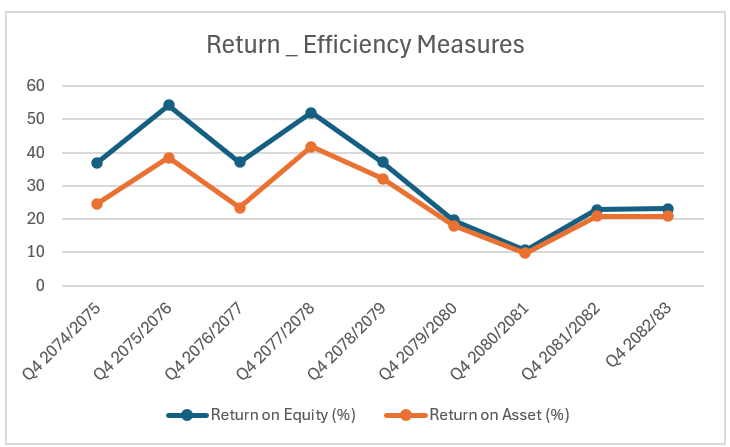
ROE remained relatively strong during the earlier years, reaching a high of 54.33% in Q4 2075/76. However, it declined significantly to 10.56% in Q4 2080/81 as equity expanded and profitability weakened. ROE subsequently improved to 22.83% in Q4 2081/82 and 23.13% in Q4 2082/83, indicating a recovery in the company's ability to generate returns from shareholders' equity.
2. Return on Assets (ROA)
ROA also fluctuated during the review period, increasing from 24.65% in Q4 2074/75 to 41.71% in Q4 2077/78. It then declined to 9.72% in Q4 2080/81 before recovering to 20.85% in Q4 2081/82 and 20.90% in Q4 2082/83. The recent improvement indicates better utilization of the company's expanding asset base to generate profits.
Dividend History
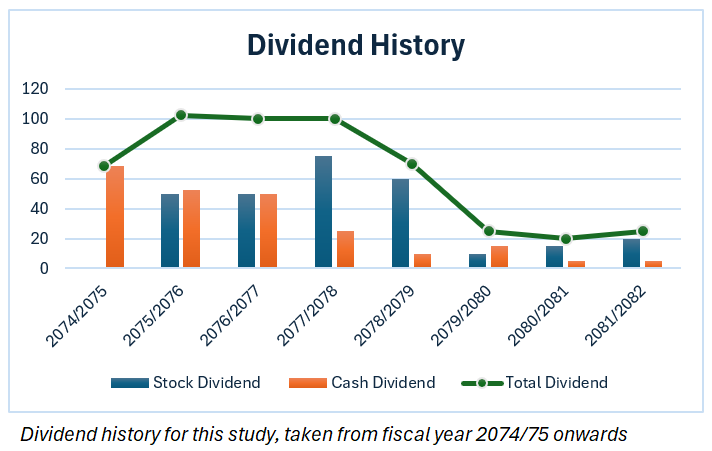
HDL has maintained a variable dividend policy during the review period. Total dividend increased from 68.42% in FY 2074/75 to a peak of 102.63% in FY 2075/76 and remained at 100% in both FY 2076/77 and FY 2077/78. Thereafter, total dividend declined to 70% in FY 2078/79 and further to 25% in FY 2079/80. It reached a low of 20% in FY 2080/81 before slightly recovering to 25% in FY 2081/82.
Data Source: The data used in this article has been obtained from SS Pro by ShareSansar.

