

Nepal’s Real Estate Landscape: Trends in Transactions, Value, Financing, and Regional Dynamics

Nepal’s real estate sector has long been a cornerstone of economic activity, serving as both a critical driver of urban development and a preferred store of wealth for households and investors. In recent years, the market has undergone notable shifts, influenced by rapid urbanization, changing land-use patterns, evolving regulatory frameworks, and fluctuations in credit availability. As population pressures intensify in urban centers and infrastructure development expands into peri-urban and semi - urban areas, the dynamics of land transactions have become increasingly complex and regionally diverse.
Here we will overview of Nepal’s real estate market by examining key indicators such as transaction volumes, total transacted area, declared values, financing trends from Bank and Financial Institutions (BFIs), and government revenue generation. By analyzing these dimensions alongside province-wise patterns, uncover underlying structural trends, including shifts in land size preferences, price movements, and regional concentration of market activity.
For this analysis, the focus is on Rajinama a category that reflects voluntary transfer or relinquishment of property rights and is commonly used to capture property buy/sell activities.
Transactions by Land Area Category
![]()
Transactions by Land Area Category highlights a clear structural pattern in Nepal’s real estate market. The 2.5–10 aana segment consistently dominates transaction volume, accounting for the largest share across all observed fiscal years. This reflects strong demand from middle-income households seeking moderately sized residential plots, particularly in expanding urban and peri-urban areas.
The 10–20 aana category shows moderate participation with relatively stable growth, might indicating demand from upper-middle-income buyers and small-scale developers. Meanwhile, transactions above 20 aana, although significant in absolute terms, display some fluctuation suggesting sensitivity to macroeconomic conditions such as liquidity, interest rates, and regulatory tightening.
At the lower end, plots below 2.5 aana show gradual but steady growth. This trend points toward increasing land fragmentation and affordability driven demand, especially in densely populated urban centers. Overall, based on data we can conclude that Nepal’s real estate market is largely end-user driven, with the mid-sized land segment acting as its core engine.
Declared Value by Land Area Category
This segment reveals a slightly different dynamic compared to transaction volume. While mid-sized plots dominate in number, the largest share of total declared value is concentrated in the higher land categories (especially above 20 aana).
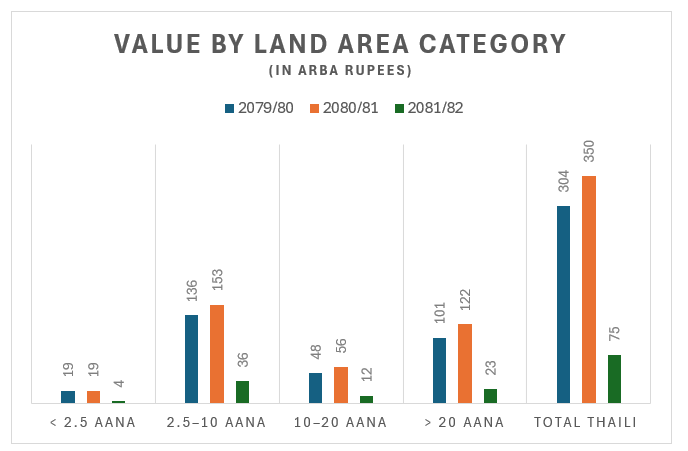
This indicates that larger land parcels, though fewer in number, carry significantly higher transaction values, reflecting their importance in commercial use, institutional investment, and long-term asset holding. The 10–20 aana category also contributes substantially to total value, reinforcing its role as a bridge between individual residential demand and larger-scale investment.
Interestingly, despite high transaction volumes, the 2.5–10 aana segment contributes proportionally less to total declared value, suggesting relatively lower per-unit pricing compared to larger plots. Meanwhile, the smallest land category (<2.5 aana) has minimal contribution to total value, even though its transaction count is gradually increasing, further emphasizing affordability constraints in the market.
Overall, the divergence between transaction volume and value distribution highlights a dual market structure: one driven by high-frequency, mid-sized residential transactions, and another driven by high-value, low-frequency large land deals.
Provincial Rajinama Transactions
Transactions presents a numerically skewed distribution of real estate activity across provinces, with a strong concentration in a few key regions.
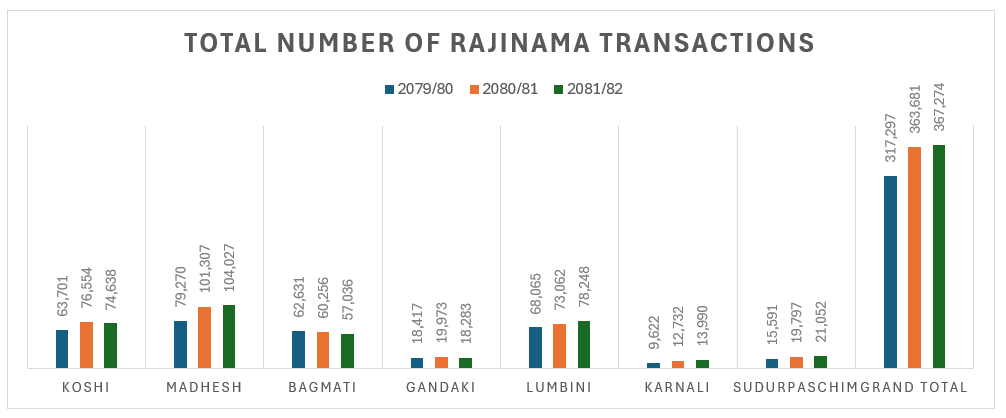
Bagmati Province alone accounts for the largest share roughly one-third (around 30 to 35%) of total Rajinama transactions. This means that about 1 in every 3 property transactions in Nepal occurs in Bagmati, this dominance observed because of out of 6 metropolitan cities in country, 3 fall in Bagmati province i.e. Kathmandu, Lalitpur and Bharatpur. As well as Kathmandu Valley and surrounding urban areas also fuel the transaction.
Madhesh Province follows as the second-largest contributor, typically capturing around 20–25% of total transactions. In practical terms, this translates to approximately 1 out of every 4–5 transactions nationwide, reflecting high land market liquidity in the Terai region.
Koshi Province and Lumbini Province each contribute in the range of 12–18% of total transactions. Combined, these two provinces account for roughly one-quarter to one-third of the national total, indicating growing but still secondary real estate markets compared to Bagmati and Madhesh.
Gandaki Province holds a smaller share of around 7–10%, suggesting that fewer than 1 in 10 transactions take place in this region. The activity remains concentrated in limited urban pockets rather than being widespread.
At the lower end, Sudurpashchim Province and Karnali Province together contribute less than 10% of total transactions, with Karnali often accounting for only 2 - 4% individually. This means that combined, these provinces generate fewer transactions than Bagmati alone, highlighting a significant regional imbalance.
Overall, the numbers clearly indicate that over 60% of Nepal’s Rajinama transactions are concentrated in just two provinces Bagmati and Madhesh. In contrast, the remaining five provinces share less than 40%, reflecting strong geographic concentration, uneven economic development, and disparities in land market activity across the country.
Transactions (in Million Square Meter)
![]()
Total Area of Rajinama Transactions (in Million Square Meter) shows that the total land area transacted through Rajinama has followed a gradual upward trend, reflecting sustained activity in Nepal’s property market. The expansion in total area indicates not only an increase in transaction numbers but also a steady absorption of land into formal ownership structures.
However, the growth in transacted area appears more moderate compared to the rise in transaction counts, suggesting a shift toward smaller average plot sizes. This aligns with increasing urban density, fragmentation of land holdings, and affordability constraints. Overall, the data signals that the market is becoming more volume-driven with smaller parcels dominating total traded area.
Transaction By Value
![]()
Total Amount (in Rs. Billion) of Rajinama Transactions, the total value of real estate transactions demonstrates strong growth momentum, particularly during expansion phases of the market. The increase in transaction value reflects both rising land prices and higher market participation.
Notably, the growth in value tends to outpace the growth in physical area transacted, indicating price appreciation across land categories. This suggests that real estate continues to function as a preferred investment asset class, driven by expectations of capital gains and limited alternative investment avenues. At the same time, fluctuations in total value highlight the sector’s sensitivity to credit conditions, interest rates, and regulatory changes.
BFIs Lending for Real Estate
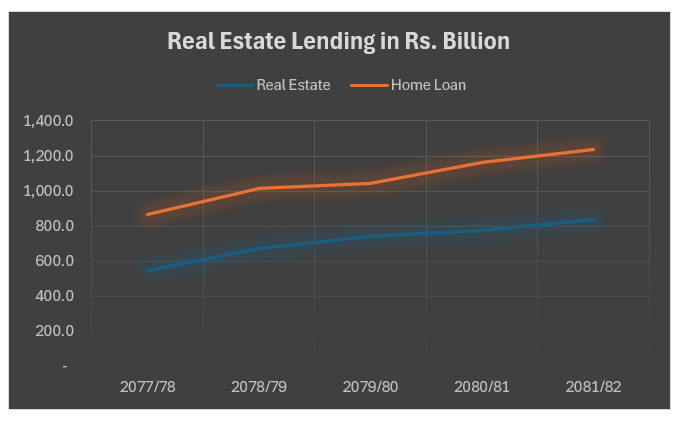
Insights from Real Estate Lending in Rs. Billion (Consolidated for Class A, B, and C Institutions) indicate that Bank and Financial Institutions (BFIs) have maintained significant exposure to the real estate sector, though growth patterns vary over time.
Lending to real estate shows periods of expansion followed by cautious moderation, reflecting regulatory interventions by the central bank and concerns over asset bubbles. The data suggests that while credit flow remains substantial, there is a gradual shift toward tighter risk management and controlled lending practices.
This trend indicates a balancing act between supporting economic activity and maintaining financial stability, with BFIs playing a critical role in shaping real estate market cycles.
Revenue for Government
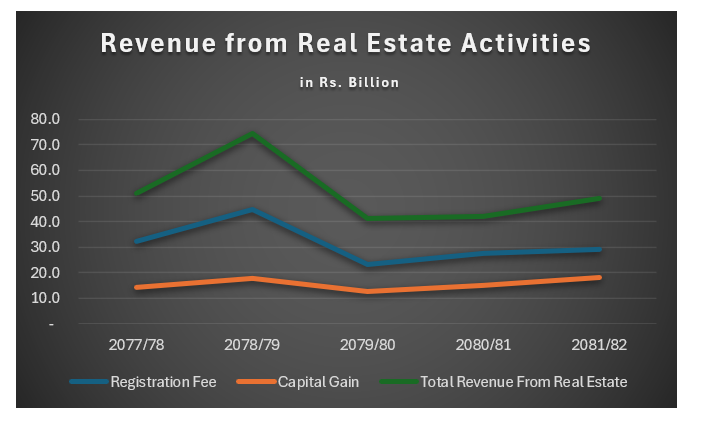
Revenue from Real Estate Activities in (Rs. Billion) shows that the government derives significant fiscal revenue from real estate transactions, primarily through registration fees, capital gains tax, and other transaction related charges.
Revenue trends generally mirror transaction activity, with higher revenues during periods of market expansion. However, even during slower transaction periods, revenue remains relatively resilient due to increasing property valuations and tax bases.
This underscores the importance of the real estate sector as a key contributor to government finances, while also highlighting the need for stable and transparent policies to ensure sustained revenue generation without discouraging market activity.
Overall Insight
Across these indicators, Nepal’s real estate sector reflects a transition toward a more structured and demand driven market. While transaction volume and value continue to grow, underlying patterns such as smaller plot sizes, regional concentration, and moderated credit expansion point toward maturing market dynamics shaped by urbanization, policy influence, and financial sector discipline.
Data and Facts use in this article taken from "A Report on Status of Real Estate Market in Nepal" Prepared by NRB _ Economic Research Department, On April 2026.
