

Miteri Development Bank (MDB): A 13 - Year Financial Performance Review (FY 2069/70 – Q3 FY 2082/83)
Thu, Jul 16, 2026 5:39 PM on Financial Analysis, Company Analysis, Latest,
.png)
Background of Miteri Development Bank (MDB)
Miteri Development Bank (MDB) commenced operations on 13 October 2006 as a regional-level Class 'B' development bank. Its head office is located at Mahendrapath-5, Dharan, Sunsari District, Koshi Province. The bank provides a wide range of development banking products and services across eastern Nepal. Over the years, it has been serving people in its operating districts while contributing to regional economic development within its capacity.
In this article, we analyze MDB's financial performance over the past 13 fiscal years, based on its fourth-quarter unaudited financial statements. The analysis covers the period from FY 2069/70 to FY 2081/82, along with the third-quarter performance of the current fiscal year (FY 2082/83).
Balance Sheet Analysis
Assets
1. Cash and Cash Equivalents
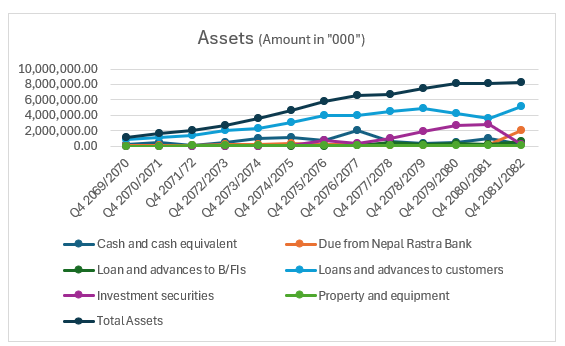
The bank's cash balance has exhibited significant fluctuations over the years. For instance, it declined sharply in FY 2071/72 (down 89.3%) and FY 2081/82 (down 76.3%), while it surged dramatically in FY 2076/77, reaching a record Rs. 2.02 billion.
Analysis: Such substantial fluctuations indicate tactical liquidity management. Periods of lower cash balances generally coincide with increased deployment of funds into higher-yielding assets, such as loans and advances or investment securities.
2. Loans and Advances to Customers
Initial Rapid Expansion: From FY 2069/70 to FY 2075/76, MDB's loan portfolio expanded consistently with strong double-digit growth, increasing from Rs. 843 million to more than Rs. 4 billion.
Contraction and Correction Phase: Lending experienced a temporary setback in FY 2076/77, declining by 0.59%, followed by more pronounced contractions of 12.75% in FY 2079/80 and 13.69% in FY 2080/81. This slowdown likely reflected tighter liquidity conditions in the banking sector, regulatory credit restrictions, and the bank's efforts to improve asset quality.
Strong Recovery: The loan portfolio rebounded strongly, growing by 42.36% in FY 2081/82. By the third quarter of FY 2082/83, loans and advances had reached a record Rs. 6.85 billion, representing an additional 32.26% increase, signaling a significant return to aggressive lending.
3. Property and Equipment
Compared to other balance sheet items, property and equipment have grown at a relatively moderate and stable pace, increasing from Rs. 8.8 million in FY 2069/70 to Rs. 41.7 million in FY 2081/82, before reaching Rs. 56.7 million by the third quarter of FY 2082/83.
4. Total Assets
Remarkable Growth: MDB has expanded its asset base substantially over the review period. Total assets increased from Rs. 1.15 billion in FY 2069/70 to Rs. 8.31 billion in FY 2081/82. By the third quarter of FY 2082/83, total assets had further increased to Rs. 10.38 billion, representing nearly a 900% increase over the past 14 years.
Liabilities
1. Deposits from Customers
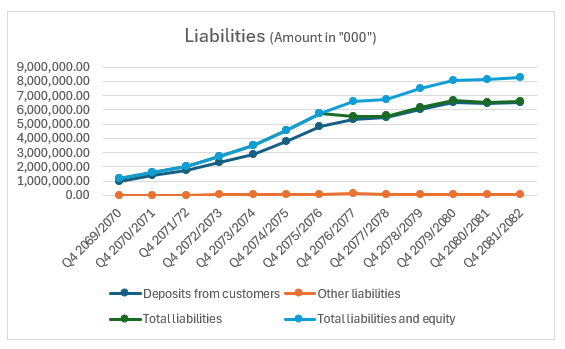
Customer deposits remain the bank's primary funding source. Deposits increased from Rs. 988.27 million in FY 2069/70 to Rs. 6.50 billion in FY 2081/82. During the first three quarters of FY 2082/83, deposits grew by an additional Rs. 2.08 billion, reaching Rs. 8.58 billion.
Throughout the review period, customer deposits consistently accounted for 95% to 99% of total liabilities, reflecting a highly conservative funding structure that relies primarily on customer deposits rather than central bank borrowings or other debt instruments.
Strong Rebound: Similar to the lending trend, deposit growth remained subdued between FY 2077/78 and FY 2081/82, even declining by 1.25% in FY 2080/81. However, deposits rebounded strongly in the third quarter of FY 2082/83, recording an impressive 31.88% increase, indicating successful liquidity mobilization.
2. Other Liabilities
Other liabilities peaked at Rs. 127.65 million in FY 2076/77, likely due to deferred expenses, accrued operational liabilities, or additional regulatory provisions during a period of economic uncertainty.
Following that peak, MDB gradually reduced other liabilities, maintaining them within the range of Rs. 57 million to Rs. 60 million during the last three fiscal years, reflecting improved operational efficiency and tighter cost management.
3. Total Liabilities
Interestingly, in FY 2076/77, total liabilities declined by 3.48%, despite customer deposits increasing by 10.82%. This suggests that the bank systematically reduced other costly liabilities, including interbank borrowings.
Total liabilities closely mirrored deposit trends, remaining relatively flat for several years before increasing sharply by 31.72%, reaching Rs. 8.68 billion by the third quarter of FY 2082/83.
4. Equity Analysis
Until FY 2075/76, total liabilities were almost identical to total liabilities and equity, largely because the bank's equity base remained relatively small under the previous accounting framework.
Healthy Capital Structure: As of the third quarter of FY 2082/83, total equity stood at Rs. 1.69 billion, accounting for approximately 16.3% of total assets. This indicates that MDB maintains a healthy capital cushion capable of absorbing potential asset quality shocks while remaining comfortably above regulatory capital requirements.
Profit and Loss Analysis
1. Interest Income and Interest Expense
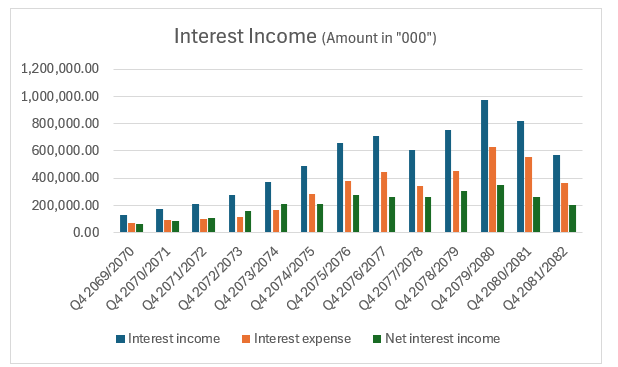
Interest income and interest expense represent the bank's core revenue-generating activities and the cost of funding those assets.
Interest income experienced remarkable growth for nearly a decade, peaking at Rs. 976.53 million in FY 2079/80. Thereafter, both interest income and interest expense declined steadily. By the third quarter of FY 2082/83, interest income had fallen to Rs. 493.75 million.
Notably, during the declining interest rate environment, MDB reduced its funding costs more rapidly than its lending yields. In the third quarter of FY 2082/83, interest income declined by 13.55%, while interest expense decreased by an even larger 25.81%.
2. Net Interest Income
Net Interest Income (NII), the bank's primary earnings driver, peaked at Rs. 348.52 million in FY 2079/80 before declining significantly over the following two fiscal years to Rs. 204.32 million.
Turning Point: Encouragingly, NII recovered during the third quarter of FY 2082/83, increasing by 8.44% to Rs. 221.58 million, suggesting that pressure on net interest margins may have begun to ease.
3. Net Fees and Commission Income
Net fees and commission income represent transaction fees, service charges, and other non-interest income.
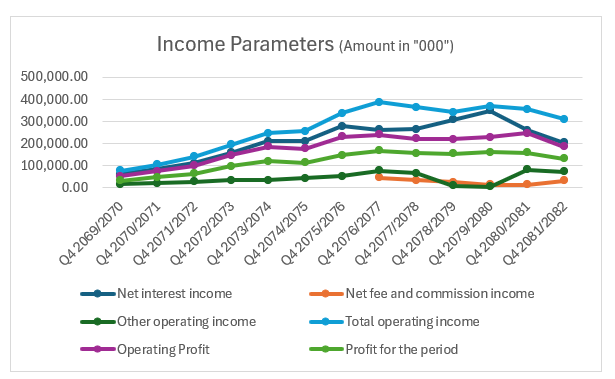
Before FY 2076/77, fee income remained relatively modest. However, it surged to Rs. 46.21 million in FY 2076/77, suggesting the introduction of new banking services, digital banking products, or higher fee-generating business activities.
Fee income has remained highly cyclical and closely aligned with lending activity. As lending rebounded in FY 2081/82, fee income also increased sharply by 123.60%.
4. Operating Profit and Net Profit
Operating profit reflects the bank's profitability before taxation and provisioning, while net profit represents earnings attributable to shareholders.
MDB recorded its highest net profit of Rs. 167.39 million in FY 2076/77 and maintained annual profits within the Rs. 150–160 million range for several years.
However, both operating profit and net profit have come under considerable pressure during the past two years. By the third quarter of FY 2082/83, net profit had declined to Rs. 96.22 million, marking the first time since FY 2072/73 that quarterly net profit fell below Rs. 100 million.
Strategic Challenge: Going forward, the bank's primary challenge will be controlling personnel and operating expenses. As operating income remains under pressure, improving cost efficiency will be essential for restoring profitability.
Trends in Key Performance Indicators
Earnings Metrics
Earnings Per Share (EPS)
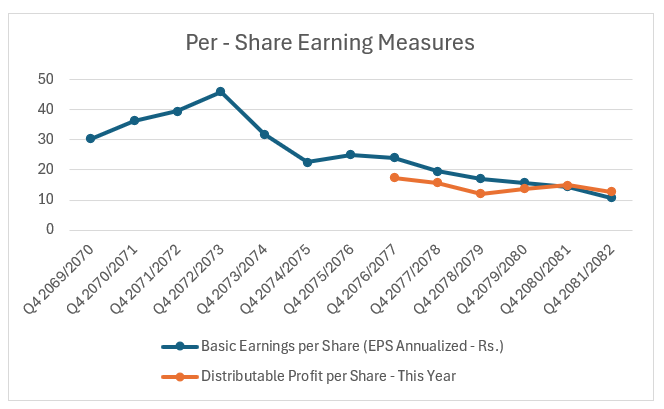
MDB reported an EPS of Rs. 30.42 in FY 2069/70. EPS increased steadily and reached a peak of Rs. 46.02 in FY 2072/73. Thereafter, earnings followed a downward trend, with EPS declining to Rs. 10.81 in FY 2081/82. As of the third quarter of FY 2082/83, EPS stood at Rs. 10.54.
Efficiency Measures
Return on Equity (RoE)
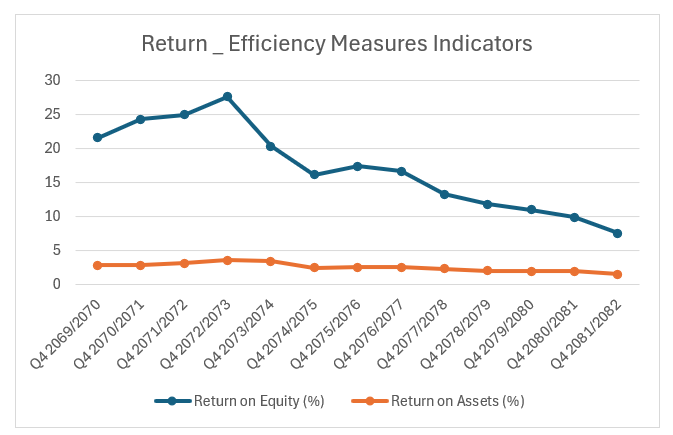
Return on Equity (RoE) measures how efficiently shareholders' funds are utilized to generate profits. MDB recorded an RoE of 21.62% in FY 2069/70, which increased to a peak of 27.67% in FY 2072/73. Since then, RoE has gradually declined, reaching 7.59% by the third quarter of FY 2082/83.
Return on Assets (RoA)
MDB achieved its highest Return on Assets (RoA) in FY 2072/73. Thereafter, RoA has remained relatively stable before gradually trending downward in recent years.
Valuation Multiples
Price-to-Earnings (P/E) Ratio and Price-to-Book (P/B) Ratio
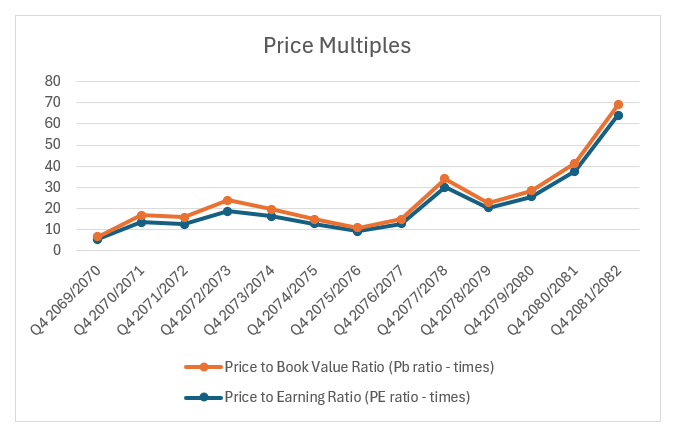
MDB's P/E ratio remained below 20 times until FY 2076/77. Thereafter, it followed an upward trend as the market price increased while earnings continued to decline.
Similarly, the P/B ratio has consistently remained below 5 times, averaging 3.04 times over the past 14 years. This reflects that the market price has grown faster than the bank's net worth per share. During the review period, MDB maintained an average Net Worth Per Share (NWPS) of Rs. 147.52.
Health Indicators
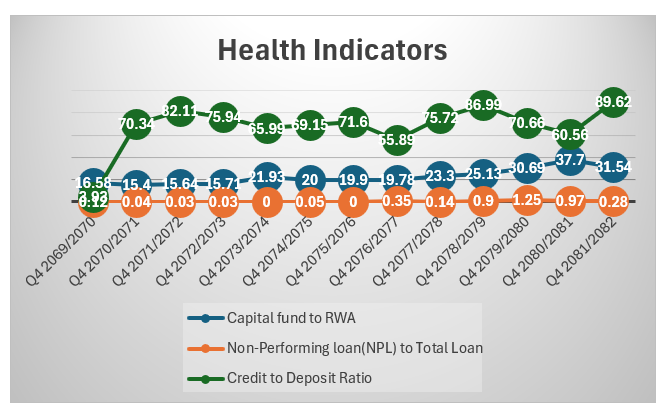
MDB has consistently maintained its Capital Fund to Risk-Weighted Assets Ratio (CAR) at a healthy level, demonstrating a strong capital position.
The bank has also maintained an efficient lending position. As of the third quarter of FY 2082/83, the Credit-to-Deposit (CD) ratio stood at 85.76%, indicating effective mobilization of customer deposits into productive lending.
Despite being a regional development bank, MDB has maintained an exceptionally low level of Non-Performing Loans (NPLs). As of the third quarter of FY 2082/83, the NPL ratio stood at only 0.48% of total loans, reflecting strong credit quality and prudent risk management.
Dividend History
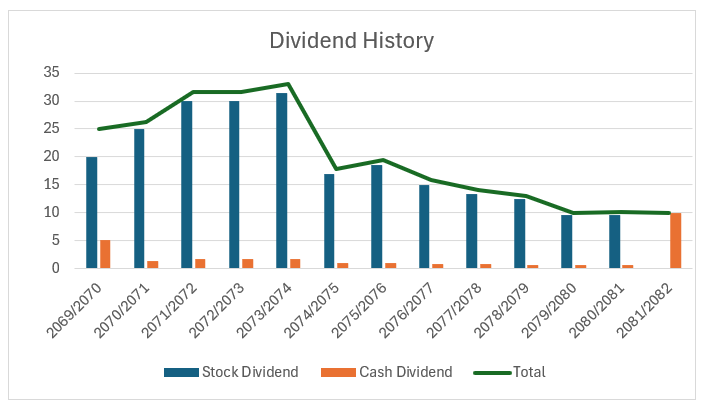
MDB has maintained a strong dividend distribution history. The bank declared its highest dividend of 33.14% in FY 2073/74. Since then, however, dividend payouts have gradually declined in line with the moderation in profitability.
Note: This article provides an analysis of MDB's financial report only and does not attempt to draw any conclusions or make any judgments.

