Dheerusha Tiwari
Standard Chartered Bank Nepal Limited (SCB), Everest Bank Limited (EBL) and Nabil Bank Limited (NABIL) are three of the leading banks in Nepalese commercial banking industry. Three of these banks have been operating in the country since at least last 23 years. The secondary market seems to favor SCB with higher trading price in the market at the present context, yet we object it.
SCB, EBL and NABIL are similar in several aspects. All three of the banks namely SCB, EBL and NABIL were established as joint venture in partnership with foreign companies such as Standard Chartered Grindlays, Australia, Punjab National Bank Ltd., and NB International respectively. Unlike other Nepalese banks, these banks did not go into merger and acquisition in order to meet the Rs 8 arba paid-up capital. These banks rather chose to achieve the targeted capital requirement through public issue. All the three banks have similar promoter public share structure of 70:30. All these three banks now hold approximately same amount of paid up capital.
With all these similarities, a major slip-up seems in Nepalese secondary market. The price at which SCB is being traded is 22% higher than EBL whereas there is no significant difference in the LTP of SCB and NABIL. The financial fundamentals and operational exposure of the banks clearly shows NABIL and EBL are in the better position than SCB. However, the recent 100% bonus share announcement from SCB has led all the investors to run after the shares of SCB. Yet, if we analyze the financial performance of these companies, it is now time to sell the stocks of SCB and get hold of other stocks. The statement is further justified by the following evidences:
| Particulars |
SCB |
EBL |
NABIL |
| Paid up capital as of 3rd Jan, 2017 in NRs |
8,011,430,600 |
8,026,863,700 |
8,038,602,500 |
| Reserve and surplus after bonus adjustment in NRs |
4,275,837,400 |
5,021,242,857 |
6,905,082,000 |
| Net profit as of Q1 of 74/75 FY in NRs |
482,531,000 |
531,474,000 |
847,815,000 |
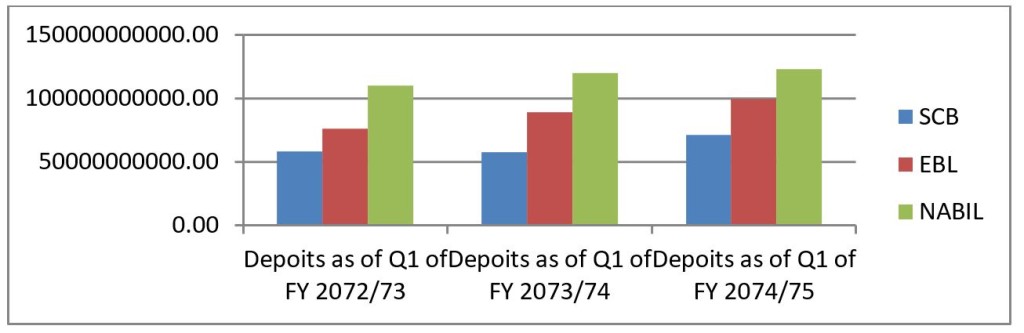
| Deposits as of Q1 of 74/75 FY in NRs |
71,421,579,000 |
99,371,205,000 |
122,797,023,000 |
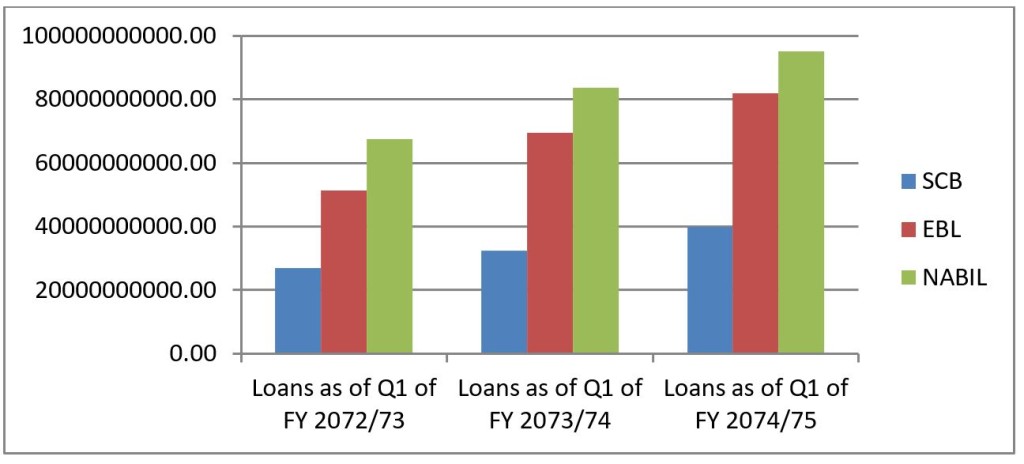
| Loans as of Q1 of 74/75 FY in NRs |
39,851,258,000 |
81,859,369,000 |
94,984,424,000 |
| EPS (annualized) in NRs |
24.09 |
26.48 |
42.18 |
| Market Price as of 3rd Jan, 2018 in NRs |
1,051 |
856 |
1,055 |
| No of branches as updated in the website |
12 |
64 |
62 |
| No. of ATMs as updated in the website |
23 |
94 |
111 |
| NPL as of Q1 of 74/75 FY |
0.18% |
0.26% |
1.11% |
| Base rate as updated in the website |
6.47% |
5.73% |
6.82% |
| Promoter public share structure |
70.21% - 29.79% |
70% - 30% |
70% - 30% |
Firstly, now that all these three banks are in the same range of paid -p capital, the race is same for all three of them. The winner of the race will be determined by the profit and exposure of these banks. For instance, the figures clearly show that SCB has the least amount of net profit than the other two. The net profit of EBL and NABIL is 10.14% and 75.70% higher than SCB respectively. This implies that those shareholders, who hold the shares of SCB today, might get less return in the upcoming days. The net profit of these banks directly impacts the EPS. This means in the FY 2074/75, the SCB’s shareholders will gain an annualized EPS of Rs 24.09 while the shareholders of EBL and NABIL will attain an EPS of Rs 26.48 and Rs 42.18 respectively. A winner is clearly seen in terms of net profit and EPS.
Secondly, all three banks have to adjust their reserve and surplus fund once the bonus share is distributed. The 100% bonus share that SCB provided was from the premium collected by the bank through the issuance of FPO. The premium on each share was Rs 1,190 carried to reserve and surplus fund, and thus the bank provided majority of its bonus from its FPO premium reserve rather than the operating profit reserve. After the bonus adjustment, SCB’s reserve and surplus has decreased straight from Rs 8.55 arba to Rs 4.27 arba. The reserve fund of EBL and NABIL is 17.43% and 61.49% higher than that of SCB’s. This suggests that the net worth per share of SCB will also decline compared to EBL and NABIL. As of today, SCB’s (adjusted) net worth per share stands around Rs 150 while its Market price is around Rs 1,051. Thus, investors with shares of SCB are incurring higher opportunity cost.
In terms of operational efficiency, NABIL followed by EBL has been maintaining higher deposits and loans than SCB. Similarly, NABIL and EBL have higher network exposure through its branches and ATM outlets as compared to SCB. SCB has centralized its operation only to 12 branches and 23 operations. This shows that SCB may not be the right choice of investment for investors.
NABIL and EBL are performing far better than SCB. SCB has to grow tremendously in order to match the performance of NABIL and EBL. The end of fiscal year is just six months away. It is doubtful that SCB will be able to match up its financial and operational efficiency with NABIL and EBL. Therefore, the higher share price of SCB in secondary market is simply the herding behavior shown by the noisy traders in Nepalese secondary market. Any smart player will identify its high time he/she should give up on SCB’s shares in exchange for NABIL or EBL.
Furthermore, the 20 to 25% of price difference between EBL and SCB also implies that SCB should able to provide 20% to 25% higher return in the coming fiscal year yet its inability can be clearly observed from the financial performance.
“The share price of SCB was once Rs 3,000” has now become a “once upon a time story”. Thus, investors are urged to make a decision based on the current financial performance rather than simply considering brand names and historical prices.
Also See:
See how much will be the EPS of EBL, NIB, NABIL & SCB after paid-up capital of Rs 8 arba? Is it worth to buy SCB in greed of 100% bonus shares?


