


Climate Change and the Nepalese Capital Market

Thu, Sep 10, 2026 8:17 AM on Economy, NEPSE News, Stock Market, Exclusive,

Conventionally, investors have relied mainly on fundamentals and behavioral factors to examine the returns of the capital market. Among several factors affecting the capital market, such as the macroeconomic conditions of the country, the fundamentals of the firm, the political scenario of the state, and investors' sentiment, the effect of climate change events has emerged as a key factor affecting the capital market in recent times.
Markets around the globe are navigating a decisive paradigm shift, transitioning from a historical reliance on isolated fundamental analysis toward the sophisticated pricing of environmental and transition risks. For the long-term stability of market returns, treating climate change not as a peripheral ecological concern but as a systemic financial risk is a strategic necessity for regulators and investors.
Nepal’s policy evolution, from the 1994 ratification of the UNFCCC to the 2011 Climate Change Policy and the 2021 National Adaptation Plan. It has laid a governance foundation, yet these frameworks remain decoupled from financial oversight. We must now address the "Triple Threat" identified in recent macro-financial research: climate-induced fiscal strain on the national budget, heightened macroeconomic volatility, and acute vulnerabilities in the Balance of Payments (BOP).
As the real and financial sectors converge, the oversight of climate-risk transmission into capital markets becomes the primary defense against systemic insolvency. This imperative is substantiated by empirical evidence revealing that climate-related information has become a dominant driver of asset valuation and market sentiment in Nepal.
According to Carney (2015), climate change, proxied by a series of climate change-related events, is broadly classified into three categories: firstly, the transitional risk driven by changes in policy, legal frameworks, and technology; secondly, the physical risk arising from climate and weather-related events; and thirdly, liability risk arising from the effects of climate change that could arise tomorrow.
Synthesizing this classification, this study operationalizes climate change into a singular framework, capturing such underlying climate events exactly as they are reflected in online news portals (Engle et al., 2020; Bua et al., 2024; Arteaga Garavito et al., 2025). Assuming the news is a matter of fact and the media publishes only true information. We’ve computed a daily climate change index using linguistic analysis. These indices were calculated using the daily news published in Nepalese news portals against the climate change vocabulary using Term Frequency – Inverse Document Frequency. The list of online news portals is:
|
News Portal |
Total News |
Website |
|
Republica |
110536 |
|
|
Sharesansar |
62628 |
|
|
Annapurna Express |
9750 |
|
|
Nepal News |
47789 |
|
|
Setopati |
23678 |
|
|
Ratopati |
18951 |
|
|
Ratopati Stories |
43287 |
|
|
Annapurna Stories |
26573 |
|
|
Total |
343192 |
|
|
Note: * for {id}, we've provided a range from 1 to 100000 |
||
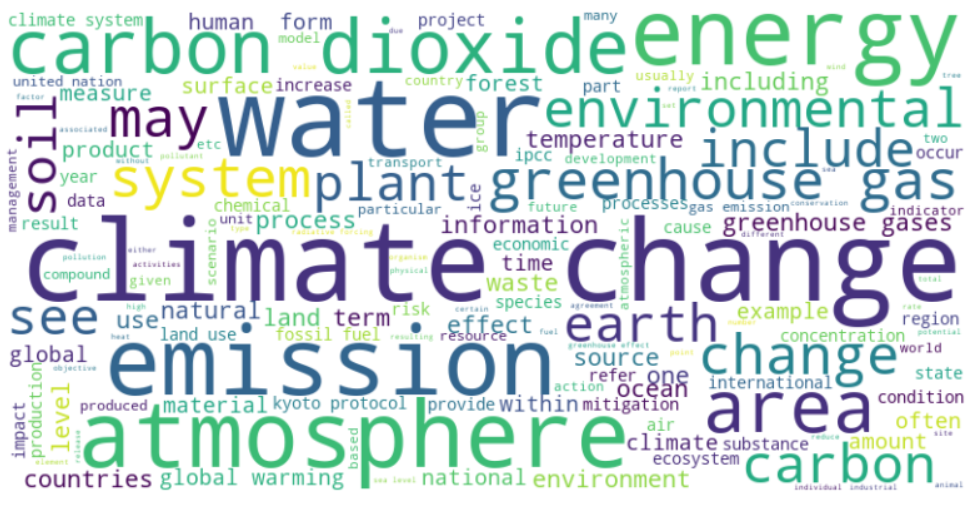
Likewise, we’ve developed a unique climate change vocabulary using 21 online dictionaries, with 2438 unique terms and their definition after removing duplicates. The word cloud of the dictionary looks like:
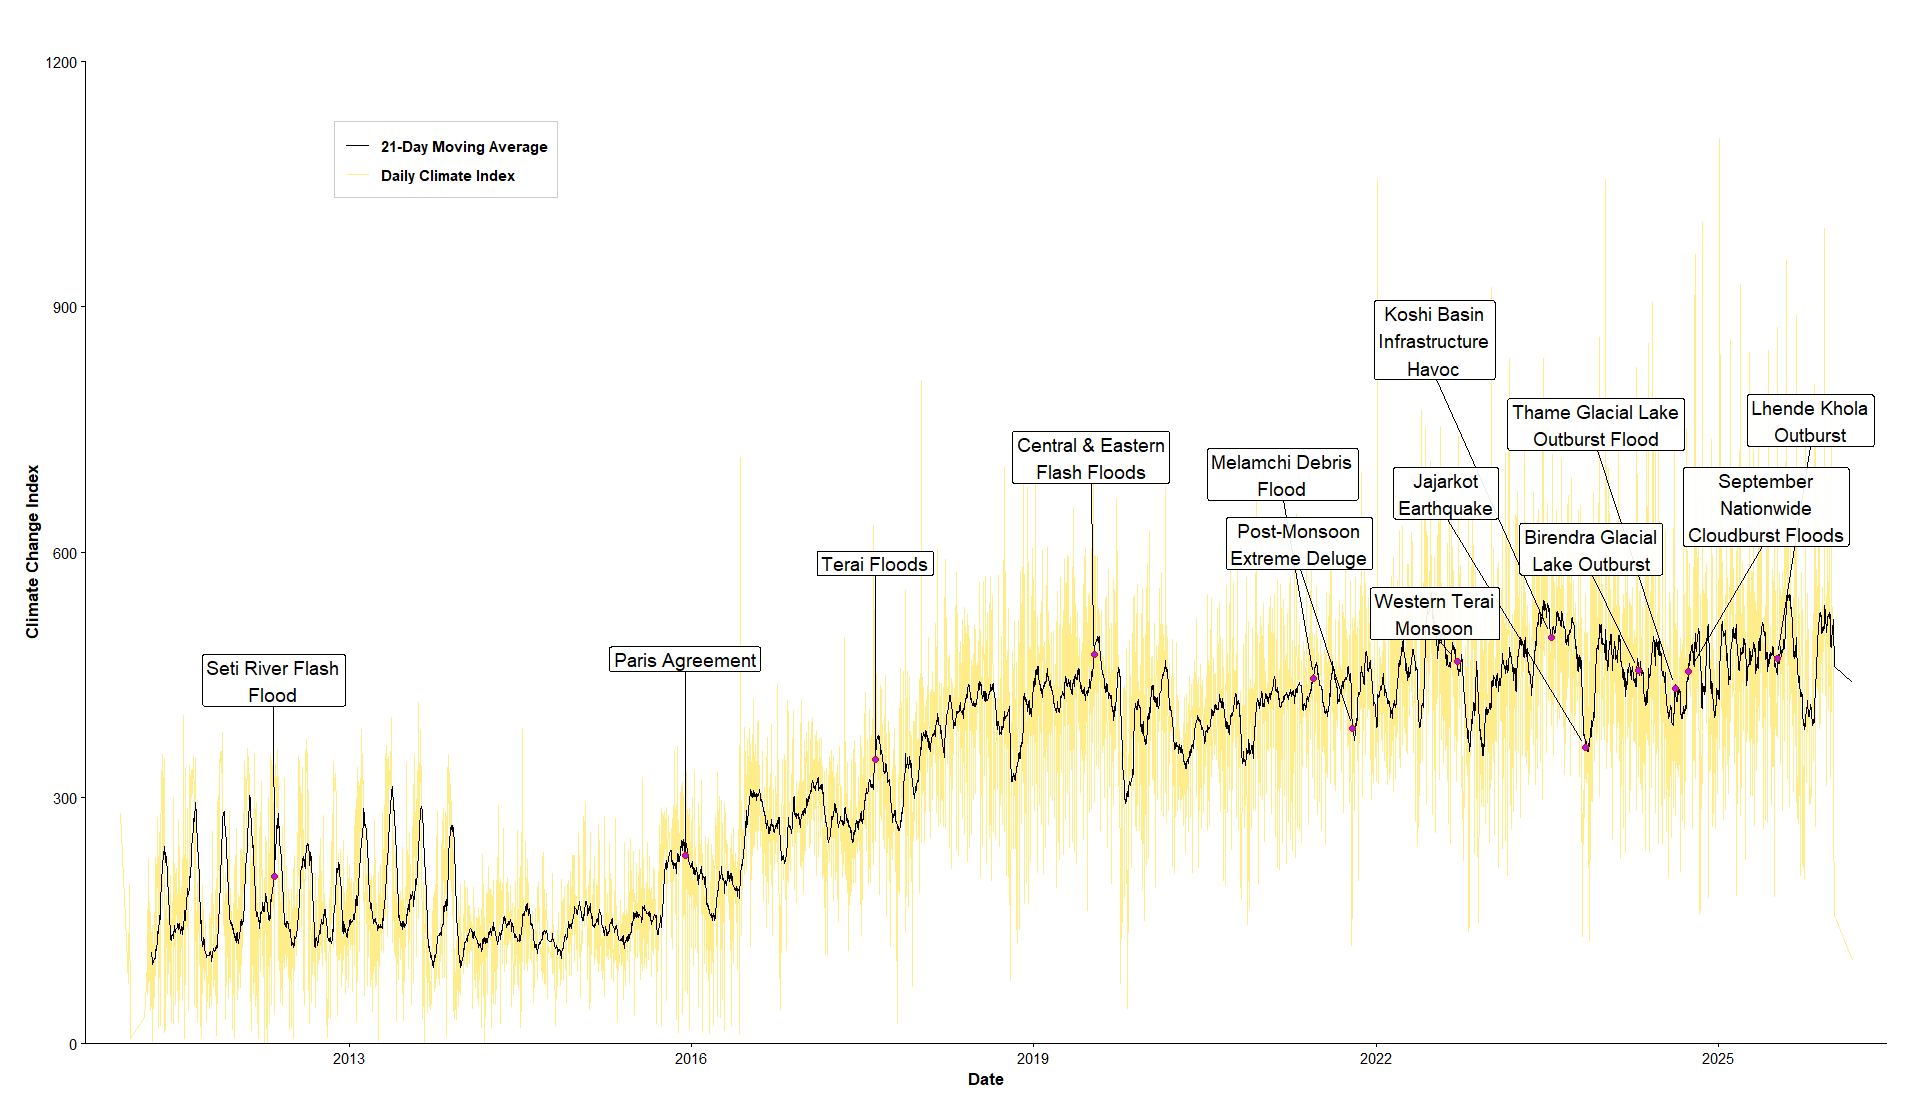
Then we computed a daily climate change index and validated it against some real climate change events that occurred during the study period.
The next part of our analysis requires an understanding of "Salience Theory," which identifies that investors disproportionately weight vivid and attention-grabbing climate information such as physical climate change disasters (erratic rainfall, landslides, glacial melts, etc.) or transitional events such as policy shifts over slow-moving environmental trends. The investors' behavior under salience theory is categorized as:
Phase 1 (High Salience): Rapid surge in attention, rising risk aversion, and stock price drops beyond fundamentals.
Phase 2 (Attention Decay): Media coverage fades, and markets partially recover/mean-revert.
Phase 3 (Low Salience): Gradual trends continue but remain undervalued, leaving the market vulnerable to the next surprise.
This "High Salience" serves as the primary vector for market shocks, where heightened intensity of climate change triggers heightened cognitive salience. To compute the proxy for salience, we use a 21-day Moving Average-Moving Standard Deviation (MAMSD) for 15-year time-series analysis (2011 Jan – 2025 Dec). Then we categorized high-salience climate change and low-salience climate change using the following condition:

Using the exact condition, we computed the high-return days above and below the average daily return across the sectors of NEPSE, and the distribution of such variables looks like:
|
Normal days |
Low return days |
Exceed (%) |
Normal days |
High return days |
Exceed (%) |
||
|
Climate L |
3163 |
250 |
7.3% |
Climate H |
2759 |
654 |
19.2% |
|
NEPSE returns L |
2952 |
461 |
13.5% |
NEPSE returns H |
2932 |
481 |
14.1% |
|
hydro returns L |
2986 |
427 |
12.5% |
hydro returns H |
2937 |
476 |
13.9% |
|
non-life returns L |
1475 |
209 |
12.4% |
non-life returns H |
1445 |
239 |
14.2% |
|
life returns L |
1479 |
205 |
12.2% |
Life returns H |
1450 |
234 |
13.9% |
|
Banking returns L |
2989 |
424 |
12.4% |
Banking returns H |
2925 |
488 |
14.3% |
|
Hotel return L |
2992 |
417 |
12.2% |
Hotel return H |
2942 |
467 |
13.7% |
Relationship between Climate Salience and Market Performance
- a) Return Modeling
Autoregressive Integrated Moving Average Model Results
|
|
nepse |
hydropower |
non-life insurance |
life insurance |
banking |
hotels |
| ∅1 |
-0.2915 |
-1.225*** |
0.7037*** |
0.8349*** |
0.2139*** |
-0.25 |
| ∅2 |
-0.4724** |
-0.4445*** |
-0.1325*** |
-0.1461*** |
-0.0913*** |
-0.0196 |
| ∅3 |
0.0808. |
- |
0.1163*** |
0.1015*** |
- |
- |
| θ1 |
0.449. |
1.3614*** |
-0.6169*** |
-0.7433*** |
- |
0.25 |
| θ2 |
0.4633** |
0.554*** |
- |
- |
- |
- |
|
intercept |
0.0023** |
0.004*** |
0.0051** |
0.005** |
0.001 |
0.0026* |
|
ClimateL |
-0.0007 |
-0.0008 |
0.0006 |
0.0014 |
-0.0011 |
0.0003 |
|
ClimateH |
-0.0027*** |
-0.0042*** |
-0.0023* |
-0.0035*** |
-0.0023*** |
-0.0029*** |
|
Month FE |
Yes |
Yes |
Yes |
Yes |
Yes |
Yes |
|
Box-Ljung (X2)† |
14.05 |
4.042 |
1.6895 |
5.2197 |
21.144*** |
7.0305 |
|
AIC |
-19911.25 |
-17644.54 |
-8937.64 |
-8812.58 |
-19070.44 |
-17600.55 |
|
Log likelihood |
9975.62 |
8841.27 |
4487.82 |
4425.29 |
9551.22 |
8818.28 |
|
Note: *** p< 0.001, ** p< 0.01, * p< 0.05, . P< 0.1 |
||||||
To address the stochastic noise and mitigate the potential biases arising from autocorrelation and heteroscedasticity in the market return study, we employ an Autoregressive Integrated Moving Average (ARIMA) framework. The results derived from returns modeling provide a more granular lens into the internal momentum and temporal dependencies of the Nepalese capital market. The empirical results from the ARIMA models demonstrate significant internal dynamics across the Nepalese stock market and its constituent sectors.
The models for each sector are selected based on the Akaike Information Criterion (AIC); each sector is governed by distinct internal dynamics and serial dependence. Rather than absorbing climate information instantaneously, the market exhibits information diffusion frictions, and climate-induced shocks are filtered through gradually over time. High-salience climate events exert an immediate negative impact on overall market returns as well as across the hydropower, banking, and hotel sectors, whereas low-salience climate trends show no significant immediate effect. The negative and significant AR terms indicate a cyclical mean-reverting process, where past shocks influence current returns in a lingering, corrective manner.
A conditional mean response of ClimateH remains negative and statistically significant, specifically -0.0023 for banking, -0.0027 for NEPSE, -0.0029 for hotels, and -0.0042 for Hydropower even after controlling for the seasonality. This reinforces our core proposition that high-salience CC represents an independent, fundamental shock, but the degree of shock is weak in the non-life sector compared to the remaining sectors.
The fact that the CC significance survives the inclusion of AR and MA terms proves that the market’s bearish reaction to CC is not a mere byproduct of general market momentum or technical correction, but a distinct revaluation of asset prices based on growing environmental concern. This exposes a vulnerability in the economy, and hydrological cycles represent a systematic, priced risk that cannot be diversified away through temporal adjustments.
The return series across all sectors are stationary I(0), establishing an integration order of d = 0. While the high Log-Likelihood and Box-Ljung test (X2) values suggest that the ARIMA framework captures the linear mean dynamics in NEPSE and all sectors but the banking reveal the presence of remaining non-linear dependencies.
The persistent residual dependence in the AR (2) model is an empirical limitation stemming from mis-specified volatility clustering in banking returns rather than mean mis-specification, leaving inference on climate salience fully intact. The existence of volatility clustering means that large shocks are followed by further large shocks of either sign. This residual heteroscedasticity provides the formal econometric rationale for our subsequent transition to the eGARCH framework presented in the following table, ensuring that we accurately quantify the time-varying and conditional volatility driven by CC.
- b) Volatility Modeling
eGARCH Model Result
|
|
nepse |
hydropower |
non-life insurance |
life insurance |
banking |
hotels |
|
ω |
-1.9672*** |
-1.7356*** |
-1.0874** |
-1.0215** |
-2.2176*** |
-0.617* |
|
α |
-0.0126 |
0.0211 |
0.0432 |
0.0653* |
0.0376 |
0.0249 |
|
β |
0.7919*** |
0.794*** |
0.8846*** |
0.8916*** |
0.7601*** |
0.9216*** |
|
γ |
0.6159*** |
0.596*** |
0.3667*** |
0.3775*** |
0.6701*** |
0.2762*** |
|
ClimateL |
0.0315 |
-0.109 |
0.0022 |
0.173 |
0.2274. |
-0.0762 |
|
ClimateH |
0.6424*** |
0.4056*** |
0.6505*** |
0.6163*** |
0.6753*** |
0.0383 |
|
Ljung-Box† |
0.0036 |
0.025 |
0.013 |
0.069 |
0.391 |
0.004 |
|
Log likelihood |
10508.87 |
9270.81 |
4,676.18 |
4,646.07 |
10,191.69 |
9,163.12 |
|
ARCH LM [3] |
0.00519 |
0.8512 |
1.0280 |
0.1503 |
0.5088 |
0.0901 |
|
Note: *** p< 0.001, ** p< 0.01, * p< 0.05, . P< 0.1 Figures in parentheses are Robust Standard Errors. ω, α, β, γ are the baseline constant, magnitude response of shocks, volatility persistence, and leverage coefficient that captures the asymmetric effect, respectively. † Test on Standardized Squared Residuals |
||||||
The primary contribution of the variance equations is the empirical confirmation that high-salience climate change also impacts volatility across the sectors. Coefficients for climateH demonstrate that CC depresses mean returns; it also escalates market volatility. When CC reaches the salience boundary, it functions as a "risk-on" signal, inducing a state of heightened price dispersion and investor anxiety.
This proves that climate change is not a background variable but a primary source of information-driven volatility. A coefficient in our eGARCH analysis is the degree of volatility persistence across all sectoral models. This persistence implies that volatility triggered by CC is acute but highly transitory.
This means a single event about a CC doesn't just affect today; it also decays rapidly within 8.5 trading days in hotels, around 6 trading days in insurance sectors, and roughly 3 trading days in banking, hydropower, and the broad market. High-salience CC generates an initial spike in conditional variance; in NEPSE, the climateH coefficient is 0.6424, implying conditional variance nearly doubles and volatility increases by around 38%.
The variance dissipates by around 50% within 3 to 6 trading days across almost all sectors. Retail attention shifts rapidly; the uncertainty is absorbed within a single trading week rather than establishing into an equity risk premium. Further, the volatility process across all sectors is stationary and non-explosive (β<1).
Volatility modelling further reflects how different sectors internalize CC. Although climateH has a strong, direct impact on mean returns in the hydropower sector, the sector simultaneously exhibits the lowest conditional volatility persistence among sectors except hotels. For Hydropower, the variance reflects the market's inability to price physical asset stranding risk and the precise magnitude of physical asset impairment.
Interestingly, high-salience CC causes no detectable effect on conditional volatility in the hotel sector even though it significantly affects index returns in ARIMA specifications. All sector except hotels shows volatility reactions to climate, with variance spikes. But hotels do not trigger heightened variance clustering or panic-driven volatility in hospitality equities.
In Banking, it signals broader concerns regarding systemic stability and the potential for a climate-driven spike in collateral deterioration and non-performing loans. The significant increase in conditional variance for both Life and Non-Life Insurance suggests that the price of equity among these sectors fluctuates at a relatively higher level compared to other sectors.
Whenever a climate-induced shock appears in the market, the market risk premium for the insurance sector stays high for a long time. Investors don't just forget the impact caused by CC events; they stay cautious because the insurance business model is fundamentally built on the long-term predictability of risk, which climate-induced shocks shatter.
The insignificance of the α parameter across NEPSE and other sectors indicates the absence of conventional leverage effects in equities except for life insurance. In the Nepalese capital market, conditional variance expands symmetrically based on shock magnitude rather than salience created by CC. It reflects that volatility clustering is driven by attention-distorting intensity regardless of whether market innovations are positive or negative.
3) Downside Risk Modeling
Logit Regression Result
|
|
nepse |
hydro |
non-life insurance |
life insurance |
banking |
hotel |
|
(Intercept) |
-2.0467*** |
-2.1705*** |
-2.1428*** |
-2.1776*** |
-2.1533*** |
-2.1171*** |
|
(0.0627) |
(0.0658) |
(0.0927) |
(0.0940) |
(0.0654) |
(0.0644) |
|
|
ClimateL |
-0.4513. |
-0.119 |
-0.2933 |
-0.4251 |
-0.4031 |
0.0058 |
|
(0.2468) |
(0.2285) |
(0.4049) |
(0.4334) |
(0.2533) |
(0.2137) |
|
|
ClimateH |
0.8775*** |
0.9324*** |
0.76*** |
0.8121*** |
0.8976*** |
0.6393*** |
|
(0.1113) |
(0.1145) |
(0.1612) |
(0.1613) |
(0.1146) |
(0.1199) |
|
|
AIC |
2641.1 |
2514.5 |
1246.4 |
1226.8 |
2502.6 |
2511.9 |
|
Note: *** p< 0.001, ** p< 0.01, * p< 0.05. P< 0.1 |
||||||
|
Figures in parentheses are Standard Errors, The dependent variable is downside return below average return |
||||||
The coefficient is positive and significant across the sector’s extreme below-average return. Downside risk modeling depicts the probability of downside extremities for nepse is 11.4%. On high climate salience days, this probability more than doubles to 23.7%. The probability of index downside roughly doubles on high climate salience days.
The maximum increase occurs in Hydropower (rising from 10.2% to 22.5%) and Banking (rising from 10.4% to 22.2%). Similarly, the probability of downside extremities for life insurance, non-life insurance, and the hotel sector is 10.2% to 20.3%, 10.5% to 20.1%, and 10,7% to 18.6%, respectively. This indicates high salience climate change purely acts as a negative shock mechanism across all sectors.
This downside return is a consequence of institutional constraints: the absence of short-selling, derivative instruments, and sophisticated institutional arbitrage capital. In the absence of hedging tools, the only available expression of negative climate sentiment is physical selling. This structural defect transforms psychological salience into "panic-driven sell-offs," where investors have no alternative mechanism to manage downside exposure.
Combining this asymmetric relationship with return modeling: the entire mean return depression caused by climate salience is fundamentally a downside phenomenon. This result supports the idea that investors in the Nepalese capital market are "loss-averse" specifically regarding environmental risk; they overreact to negative (climateH) but are indifferent to gradual or positive environmental information.
The Nepalese capital market currently operates as a " one-way street" regarding climate sentiment. This flaw turns psychological signals into systemic threats, necessitating a transition from passive observation to active regulatory mitigation.
4) Robustness of the Analysis
To examine the robustness of return and volatility modelling, we regressed ClimateL and ClimateH on the manufacturing and processing sector. According to the Macroeconomic and Fiscal Channel Transmission, Climate change creates supply-side shocks in the manufacturing sector. This means that when a climate change event affects other sectors, the demand of the manufacturing sector will increase.
Such as, when hydropower assets are physically damaged by severe floods, then the demand for cement might increase to repair that damage. In this context, neither of the climate variables affects returns in this sector, and the results support the same. Alternatively, the Manufacturing and Processing sector serves as a structural hedging mechanism within the NEPSE. During post-disaster reconstruction phases, this sector acts as a demand-side beneficiary, providing a degree of insulation against the broader index decline. Collectively, these sectoral shocks coalesce into a structural instability defined by downside risk.
|
Return Modeling
|
Volatility Modeling
|
||||||||||||||||||||||||||||||||||||||||||||||||
Additionally, we use Mixed Data Sampling (MIDAS) to bridge daily climate change and annual GDP data. The persistent climate change shocks have a marginal negative drag on Nepal's overall economic growth. This stability of significance across all specifications validates our proxy constructed to measure Climate Change in this study’s context.
|
|
Economic Growth Rate |
|
|
|
Unrestricted Midas |
Parameterized Midas |
| β0 |
0.1191***(0.00779) |
0.1259***(0.01302) |
| CC_β1 |
-0.000088(0.000147) |
-0.000097.(0.000051) |
|
Box-Ljung |
- |
(4.9019, p = 0.1791) |
|
Shapiro-Wilk |
- |
(0.98684,p = 0.9973) |
|
S.E. of residuals |
0.04381 |
0.03931 |
|
Note: *** p< 0.001, ** p< 0.01, * p< 0.05, . P< 0.1, Figures in parentheses are p-values. |
||
5) Summary and Discussion of the results
|
Metric |
Statistical Impact |
Strategic Implication |
|
Market Return |
-0.27 percentage points |
Immediate erosion of investor capital during high-salience climate change events in NEPSE |
|
Conditional Volatility |
Approximately Double (100% Increase) |
Sharp rise in price dispersion and information processing anxiety. |
|
Tail-Risk Probability |
2.4x Increase |
Significant elevation in the likelihood of a systemic downside in market returns. |
|
Volatility Persistence |
3 to 8.5 Trading Days |
Volatility is acute but transitory, requiring a response from investors and regulators. |
To safeguard the interests of retail and institutional investors, regulators must transition Nepal’s capital market framework from voluntary environmental guidelines to mandatory, standardized protocols. Ensuring that climate risk is transparently priced is the only method to prevent informational shocks from evolving into market-wide panics.
Further, regulators must integrate environmental stress-testing into the national macroprudential framework. Using the 2011–2025 baseline for conditional volatility and downside return distributions, regulators should mandate simulations that test the capital adequacy and solvency of listed firms against high-salience climate change and extreme climate events.
Strategic Action for Regulators:
- Develop Climate Change Index: An official index to monitor climate salience, utilizing it as a primary input for macroprudential stress-testing and "early warning" market signals.
- Mandatory Phased Reporting: Require all listed firms to utilize standardized templates for reporting on climate-mitigation metrics, physical asset exposure, and catastrophe management protocols.
- Portfolio Rebalancing Guidelines: Establish best-practice mandates for institutional investors to manage portfolio concentration in high-exposure sectors (e.g., Hydropower), particularly during the seasonal window.
- You readers add further .........
The stabilization of the Nepalese financial ecosystem requires immediate intervention to bridge the gap between harsh environmental reality and capital market valuation. To remain inactive in the face of this evidence represents a direct failure of fiduciary responsibility to the investors of Nepal.
We must formalize these protocols now to ensure the NEPSE is resilient enough to withstand the inevitable shocks of a changing climate. And this study ends here with an open question to investors: is your portfolio diversified against the risk occurred due to climate change?
Article By: Anil Humagain
Email: anilhuma@gmail.com
LinkedIn: https://www.linkedin.com/in/anil-humagain-680b6019a/
Contact no: +977 - 9841047446
Senior Officer at Sanima Capital Limited

