

Upper Solu Hydroelectric Company Limited (USHEC): A Five-Year Financial Performance Review (Q4 2078/79–Q4 2082/83)
Tue, Aug 11, 2026 5:08 PM on Financial Analysis, Company Analysis,
.png)
About Company Background:
Upper Solu Hydro Electric Company Limited was incorporated under the Companies Act, 2063 on 12 November 2012 (2069/07/26 B.S.) at the Office of the Company Registrar, Government of Nepal, as a private limited company. It was subsequently converted into a public limited company on 16 July 2015 (2073/04/02 B.S.).
The registered (central) office of the company is located at Hattisar, Kathmandu Metropolitan City -1, Kathmandu District. As per the prevailing Companies Act, 2063, the registered office may be relocated to another location, if required.
The project site for the company’s electricity generation business is in Solukhumbu District, at Ward Nos. 6, 7 and 11 of Solududhkunda Municipality, at locations including Saleri, Garmi, Chhulsamu, Salme and Titla.
Total Project Cost: Rs. 5,00,00,00,000/- (Rs. 500 crore), including Interest During Construction (IDC).
Cost per Megawatt: The cost per megawatt of the project is Rs. 21,27,65,157.44.
Remaining Period of Electricity Generation License: The electricity generation license is valid from 2070/12/04 B.S. to 2105/12/03 B.S., with 37 years remaining.
Payback Period (Simple Investment): 7.56 years
Discounted Payback Period: 16.16 years
The company issued its Initial Public Offering (IPO) on 2079/03/20 B.S. Out of the issued capital of Rs. 1.35 billion, the company issued 24.5% of its shares, equivalent to 3,307,500 shares, amounting to Rs. 330.75 million. The following section presents the company's financial performance over the five-year period from Q4 2078/79 to Q4 2082/83.
Balance Sheet
Assets
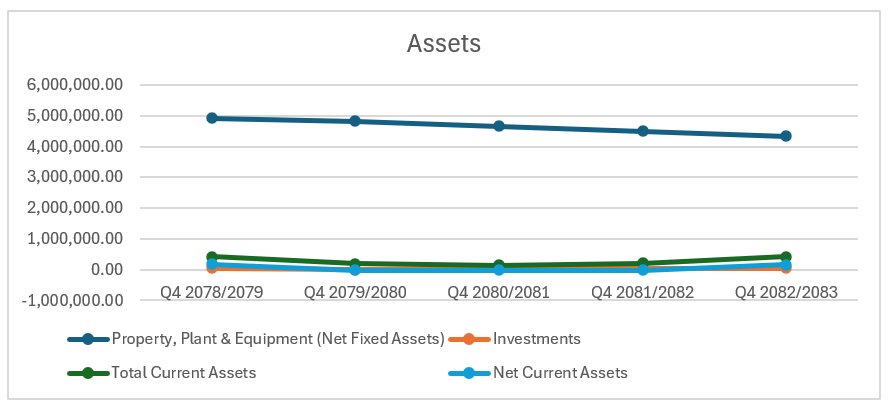
1. Property, Plant & Equipment - Net Block (Net Fixed Assets)
The net block stood at Rs. 4.93 billion in the initial period and gradually declined to Rs. 4.82 billion, Rs. 4.66 billion, Rs. 4.50 billion and Rs. 4.34 billion in the subsequent periods. Overall, net fixed assets declined by approximately Rs. 588.60 million, or 11.9%, over the period.
2. Investments
Investments remained relatively small compared with the company's total assets. They increased from approximately Rs. 44.14 million to Rs. 44.57 million, although there was a temporary decline to zero in one period.
3. Total Current Assets
Total current assets show considerable fluctuation. The latest figure represents a significant recovery. Current assets increased to approximately Rs. 427.35 million, almost returning to the level of the earliest figure in the series.
Liabilities:
1. Sources of Fund/Capital & Liabilities
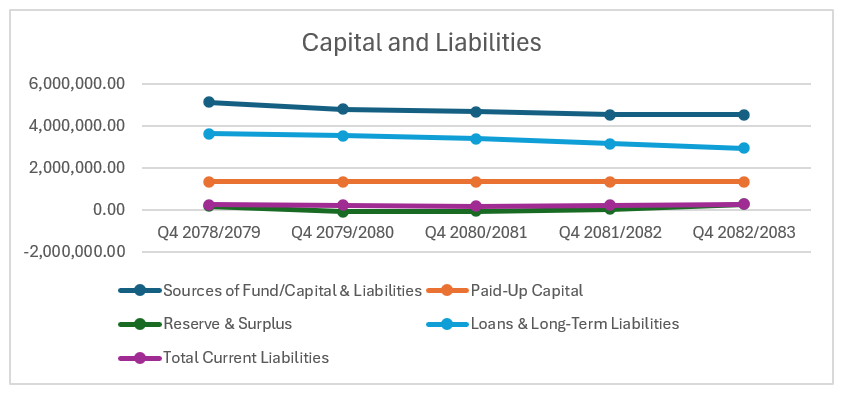
The company's total sources of funds declined from approximately Rs. 5.14 billion to Rs. 4.55 billion, representing a reduction of around 11.6%. Therefore, the decline in total funds appears to be largely associated with the reduction in fixed assets and borrowings.
2. Paid - Up Capital
Paid-up capital remained unchanged at Rs. 1.35 billion throughout the period. This means the company did not increase its paid-up equity capital during the period covered by the table.
3. Reserve & Surplus
The reserve and surplus position shows one of the most notable changes. The company initially had a negative reserve position, meaning accumulated losses had eroded a portion of shareholders' equity. However, the reserve position subsequently turned positive and reached approximately Rs. 256.76 million in the latest reported figure.
4. Loans & Long-Term Liabilities
Loans and long-term liabilities declined from approximately Rs. 3.63 billion to Rs. 2.94 billion, a reduction of about 18.8%. This is one of the strongest positive developments in the balance sheet. The debt-to-total-funds proportion also declined from 70.5% to 64.7%. In simple terms, the company is becoming less dependent on borrowed money.
5. Total Current Liabilities
Investments remained relatively small compared with the company's total assets. They increased from approximately Rs. 44.14 million to Rs. 44.57 million, although there was a temporary decline to zero in one period.
Profit and Loss Account:
1. Operating Income
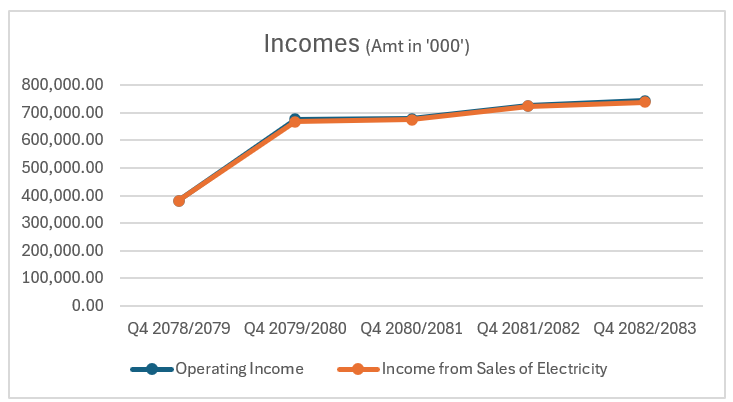
Operating income increased from Rs. 380.94 million in the initial period to Rs. 742.80 million in the latest reported period. This represents an increase of approximately 95.0%.
The growth in operating income was primarily driven by electricity sales. Income from electricity sales increased from Rs. 380.74 million to Rs. 738.29 million, almost doubling during the period. This indicates that electricity generation and sales have become the company's dominant source of revenue.
2. Income from Sales of Electricity
Income from sales of electricity is the primary source of revenue for the company and provides a clear indication of the operating performance of its hydropower project. The company’s, electricity sales have shown a strong and consistent upward trend over the review period.
Income from electricity sales increased from Rs. 380.74 million in the initial period to Rs. 667.87 million, Rs. 675.02 million, Rs. 724.05 million and Rs. 738.29 million in the subsequent periods. Overall, electricity sales increased by approximately 94%, nearly doubling during the period under review.
3. Operating Expenses
Operating expenses have generally remained under control compared with the growth in operating income. Excluding the initial figure, operating expenses increased from Rs. 108.74 million to Rs. 136.54 million over the reviewed periods. Project operating expenses increased from Rs. 35.88 million in the initial period to Rs. 102.29 million in the latest period. The increase should be viewed alongside the substantial growth in electricity sales and may reflect higher costs associated with operating and maintaining the hydropower project.
4. Depreciation Expense
Depreciation increased from Rs. 82.08 million in the initial period to Rs. 193.34 million in the latest period. The rise in depreciation is consistent with the company's large investment in hydropower infrastructure. Since the project represents a major portion of the company's asset base, depreciation remains a significant recurring expense.
5. Financial Expenses
The most important improvement in the company's income statement is the substantial reduction in financial expenses. Financial expenses declined from Rs. 414.32 million to Rs. 199.90 million, representing a reduction of approximately 51.8%.
6. Net Profit
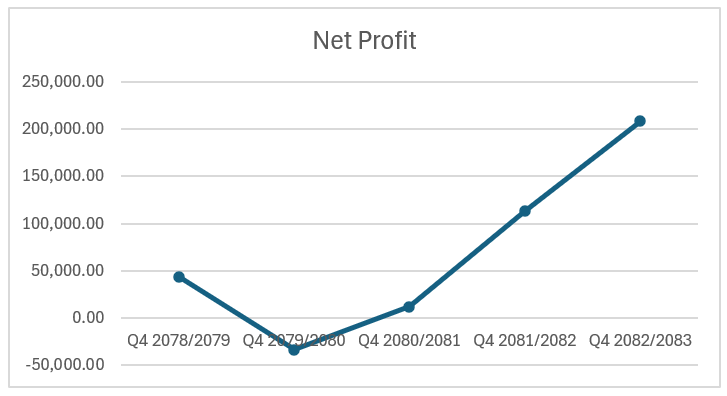
The company reported a net loss of Rs. 33.77 million in Q4 2079/80. It then returned to a small profit of Rs. 11.97 million, followed by Rs. 113.20 million and finally Rs. 208.76 million in the latest period. Thus, the latest net profit is nearly 18 times the profit recorded in Q4 2080/81.
The latest margin of approximately 28.1% means that the company generated around Rs. 28 of net profit for every Rs. 100 of operating income.
Major Indicators
1. Net worth per Share (Rs.)
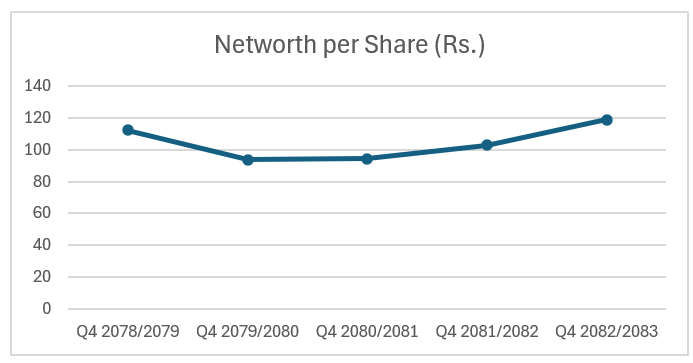
Net worth per share declined from Rs. 112.40 in Q4 2078/79 to Rs. 93.81 in Q4 2079/80. It then gradually recovered to Rs. 94.48, Rs. 102.74 and finally Rs. 119.02 in Q4 2082/83. The latest net worth of Rs. 119.02 per share is the highest in the five-year period. It is also approximately 6% higher than the initial Rs. 112.40.
2. Earnings per Share (EPS Annualized - Rs.)
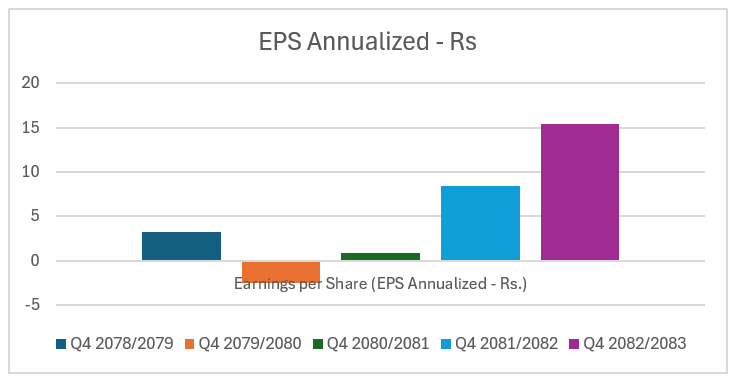
EPS shows how much profit the company earned for each share. The company's EPS moved from Rs. 3.24 in Q4 2078/79 to Rs. - 2.50 in Q4 2079/80, indicating a loss during that period. EPS then recovered to Rs. 0.89, followed by a significant increase to Rs. 8.39 and finally Rs. 15.46 in Q4 2082/83. The latest EPS of Rs. 15.46 is nearly five times the initial EPS of Rs. 3.24.
3. Return on Equity (ROE)
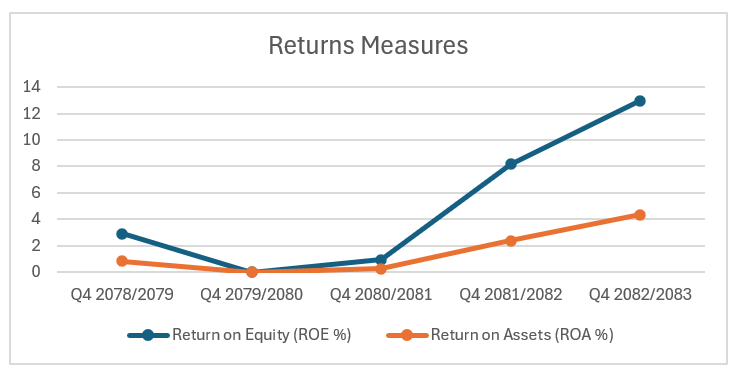
ROE shows how efficiently a company generates profit from shareholders' money. The company's ROE was 2.88% in Q4 2078/79. It then fell to zero during the loss-making period, before gradually improving to 0.94%, 8.16% and finally 12.99%. The latest ROE of 12.99% represents a significant improvement.
4. Return on Assets (ROA)
ROA measures how effectively the company uses its total assets to generate profit. The company's ROA was 0.81% initially, fell to zero during the loss-making period, and then improved to 0.25%, 2.38% and 4.34%. The latest ROA of 4.34% is the highest in the period. This means that the company generated approximately Rs. 4.34 of profit for every Rs. 100 invested in its assets.

