NEPSE at 38 Times Earnings: We Are Among the World’s Most Expensive Stock Markets
Fri, Apr 10, 2026 10:00 AM on Stock Market, Exclusive,
A comprehensive global valuation survey across 25 markets reveals that Nepal’s stock exchange commands multiples that no frontier economy in Asia or Africa comes close to matching - and that the fundamental case for these prices is far weaker than most investors realise.
There is a belief, quietly held but widely shared among Nepali retail investors, that our stock market is reasonably priced. That the 38x price-to-earnings multiple is a local quirk, a necessary premium for a small market, perhaps even a sign of confidence in Nepal’s economic story. After examining valuation data from more than twenty-five markets spanning South Asia, Southeast Asia, Africa, Latin America, and the global frontier benchmarks, I can say this with some certainty: the belief is incorrect. Nepal’s stock market is not reasonably priced. It is, by most credible measures, the most expensive frontier market on the planet.
This is not a criticism of Nepal or its investors. It is, in many ways, a structural inevitability - a consequence of a closed capital account, record remittance liquidity, and a retail investor base with nowhere else to put its money. But understanding why we are here is quite different from pretending we are not. Before the next bull market arrives, before the margin trading window opens, before thousands of new investors deploy fresh capital, it is worth pausing to ask: exactly how expensive are we, and what are we actually getting for the price we pay?
A NUMBER THAT SHOULD STOP US COLD
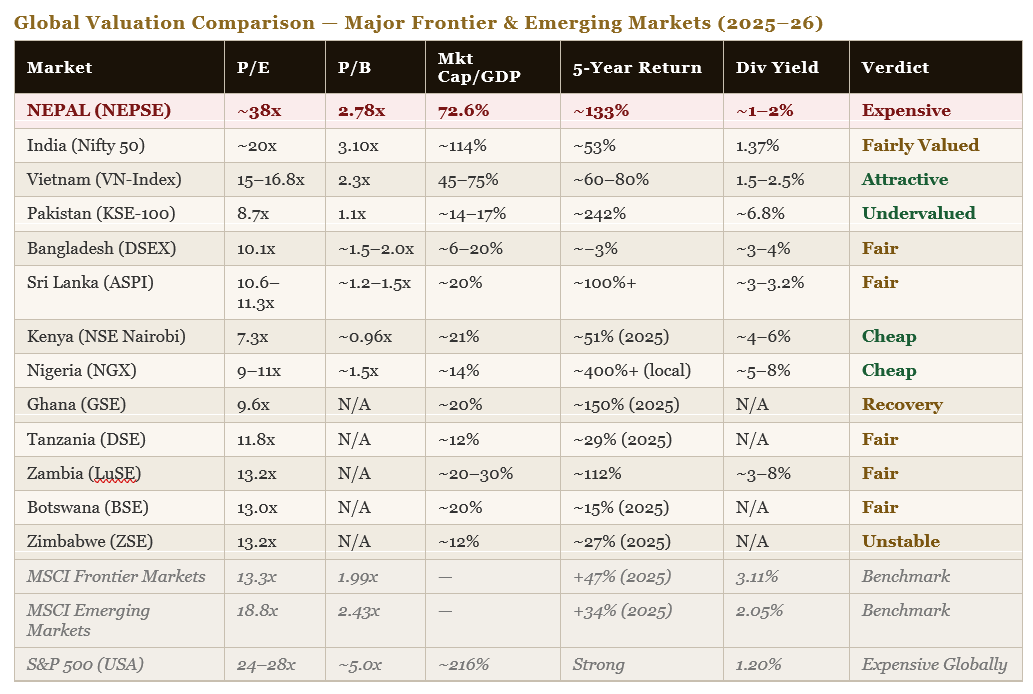
Nepal’s trailing price-to-earnings ratio of approximately 38x sits in genuinely rarified company globally. The MSCI Frontier Markets Index - the most appropriate external benchmark for a market of Nepal’s size and structure - trades at just 13.3x earnings with a price-to-book of 1.99x. The MSCI Emerging Markets Index, which includes far larger and more developed economies like China, India, and Brazil, trades at 18.8x. Even the richly valued S&P 500, after years of extraordinary gains driven by technology mega-caps growing earnings at 15 to 20 percent annually, trades at roughly 24 to 28x trailing earnings.
Nepal’s P/E is nearly three times the frontier market average. It is almost twice the emerging market average. It is higher than the world’s most celebrated stock market. And NEPSE is supported by none of the structural characteristics that justify those American multiples — no dominant technology sector, no global monopolies, no 20-percent earnings growth compounding year after year.
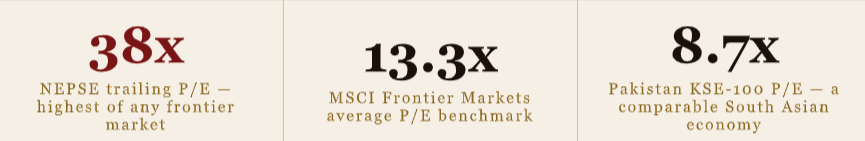
The comparison with individual peer markets is more striking still. Pakistan’s KSE-100 trades at 8.7 times earnings with a price-to-book of just 1.1x. Kenya’s Nairobi Securities Exchange trades at 7.3x - the cheapest major frontier market in Africa and arguably in the world among functioning exchanges. Nigeria’s NGX trades at roughly 9 to 11 times. Bangladesh’s DSE at 10.1x. Sri Lanka’s CSE, recovering from a severe economic crisis, at approximately 10.6 to 11.3x. Vietnam, which is presently transitioning from frontier to emerging market status and attracting record foreign institutional flows, trades at 15 to 16.8x. And India, the region’s premium market with genuinely world-class companies, a deep institutional base, and 14 to 16 percent return on equity, trades at roughly 20x on the Nifty 50.
Among all these markets — and including Tanzania at 11.8x, Ghana at 9.6x, Zambia at 13.2x, Botswana at 13x, and Zimbabwe at 13.2x — not a single one approaches Nepal’s 38x. The data leaves very little room for interpretation.
WARREN BUFFETT’S INDICATOR SAYS THE SAME THING
There is a second valuation lens, popularised by Warren Buffett, that compares a country’s total stock market capitalisation to the size of its economy. It is a simple and powerful gauge of whether a market is using up more of the national economic pie than it should. At a global average of roughly 75 percent, the ratio is a useful anchor.
Nepal’s market capitalisation-to-GDP ratio stands at approximately 72.6 percent. This places Nepal not alongside Pakistan at 14 to 17 percent, Bangladesh at 6 to 20 percent, Nigeria at 14 percent, Kenya at 21 percent, Tanzania at 12 percent, or Ghana at 20 percent — all the frontier peers one might reasonably expect Nepal to resemble. Instead, it places Nepal in the company of developed or large emerging economies. For a forty-billion-dollar economy with negligible foreign institutional
participation, a ratio near 73 percent signals that domestic capital has been chasing a very limited pool of listed assets and doing so with remarkable intensity.
The contrast is instructive. Cambodia’s equity market represents just 6 percent of its economy. Laos is at 0.5 percent. Myanmar at 0.6 percent. Even Mongolia, which has an active exchange and a commodity-rich economy, sits at roughly 17 percent. Nepal at 72.6 percent is not in this company. It is in the company of markets with deep institutional frameworks, active foreign participation, and decades of corporate earnings history to justify the weight. We have none of those things yet.
OUR RETURN ON EQUITY DOES NOT JUSTIFY OUR PRICE-TO- BOOK
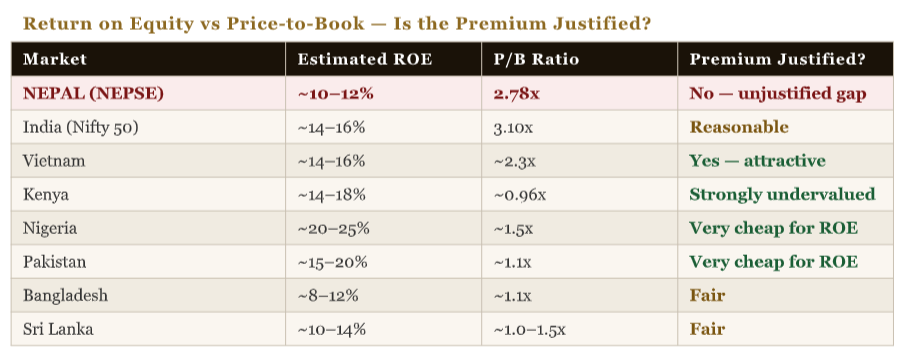
The price-to-book ratio tells investors how much they are paying for each rupee of corporate net worth. A high price-to-book is justified when companies generate strong returns on that capital. If I own a business that earns 20 percent on every rupee of equity I put in, I am willing to pay two or three times that rupee to buy a share — because the returns will eventually recoup the premium. The logic breaks down when the returns are modest.
Nepal’s estimated market-wide return on equity of 10 to 12 percent does not support a price-to-book of 2.78x. Using standard valuation frameworks, an ROE of 11 percent against a reasonable cost of equity of 12 percent would imply a fair P/B of roughly 1.0 times — less than half of where we currently trade. Compare this with Nigeria, which generates an estimated 20 to 25 percent ROE yet trades at just 1.5 times book value. Kenya produces 14 to 18 percent ROE at under 1.0 times book. Pakistan’s 15 to 20 percent ROE commands only 1.1 times book.
In the hierarchy of capital returns, Nepal’s listed companies generate below-average returns but are priced as if they were among the best in the world. That gap between perception and reality is what defines an overvalued market.
THE INCOME INVESTORS ARE NOT GETTING
Equity investing is not only about price appreciation. Dividends compound quietly in the background, and over long holding periods they constitute a substantial share of total returns. Nepal’s approximate dividend yield of 1 to 2 percent is among the lowest of any frontier market in the world.
The MSCI Frontier Markets index yields 3.11 percent. Pakistan’s market yields approximately 6.8 percent — more than triple Nepal. Kenya offers 4 to 6 percent. Nigeria 5 to 8 percent. Bangladesh 3 to 4 percent. Sri Lanka 3 to 3.2 percent. Even individual Nigerian banking stocks yield 12 to 15 percent. A Nepali investor placing ten lakhs into NEPSE receives roughly ten thousand to twenty thousand rupees
in annual dividend income. An equivalent investment in Pakistan or Kenya would generate fifty thousand to eighty thousand rupees in dividend income alone - before any capital appreciation is counted. Over a decade of compounding, this gap is not trivial. It is the difference between wealth - building and wealth-stagnating.
WHY WE ARE HERE: THE CAPTIVE MARKET EXPLANATION
Understanding how Nepal arrived at 38 times earnings requires understanding one central fact about our market: Nepali investors cannot legally invest anywhere else. The Act Restricting Investment Abroad, on the books since 1964, explicitly prohibits Nepali citizens and companies from deploying capital outside the country. Nepal’s capital account is not convertible. NRB approval is required for any meaningful outward capital transfer, and SEBON offers no international exchange-traded funds or
mutual funds for ordinary retail investors.
This creates a captive pool of capital with a single destination. Nepal’s record remittance inflows - over Rs 1,261 billion annually, representing more than 28 percent of GDP — flow into a domestic economy with limited productive investment options. With the 91-day treasury bill yielding just 2.47 percent and inflation at 2.42 percent, real returns on fixed deposits are essentially zero. Surplus capital
has nowhere to go except the stock market, real estate, or gold. The stock market, with its daily liquidity and psychological satisfaction of watching numbers move, absorbs much of this flow.
The result is textbook: a closed pool of capital chasing a fixed supply of shares, producing prices that would not survive contact with an open market. It is not that Nepali investors are irrational - they are rational within the constraints they face. The irrationality, if it can be called that, belongs to the regulatory structure that creates a captive audience for an expensive market.
A joint NRB–Bank of Korea study published in early 2026 has proposed a five-phase roadmap toward gradual capital account liberalisation. The direction is right. The timeline is undefined. The process will take years, and Nepal’s February 2025 placement on the FATF grey list adds further complications to any accelerated opening. Until liberalisation arrives and Nepali capital can seek better - priced markets abroad, the premium is likely to persist - which is precisely why new investors entering the market today need to understand what they are paying for.
THE ONE BRIGHT POCKET: COMMERCIAL BANKS
It would be unfair, and analytically imprecise, to condemn all of NEPSE uniformly. The commercial banking sector trades at a trailing P/E of approximately 15.8 times and a price-to-book of 1.51 times - multiples that are genuinely comparable to regional banking sector valuations and that place it in defensible territory by international standards. Vietnamese banks trade at roughly 1.7 times book. Sri Lankan banks are recovering toward similar levels. Nepal’s banking sector P/B of 1.51x is not cheap, but it is not a scandal either. For institutional capital seeking NEPSE exposure, commercial banks remain the most rational entry point.
The overvaluation problem is concentrated elsewhere: in insurance companies with minimal earnings, in small microfinance institutions trading at fifty to one hundred times earnings, in hydropower projects that have not yet generated a single rupee of positive EPS, and in speculative investment holding companies trading at ten times book value. These segments inflate the headline NEPSE P/E to its extreme level and give a misleading picture of what the market as a whole actually offers. An informed investor can navigate around them. But the weight of uninformed capital flowing
into these segments prevents the market from correcting toward fundamentally sensible prices.
WHAT THE DATA MEANS FOR THOSE WAITING FOR THE NEXT BULL
Every bullish investor waiting for NEPSE to reach 3,500 or 4,000 should ask themselves a simple question: on what basis would someone pay forty-five or fifty times earnings for Nepali stocks when the global frontier market average is thirteen times? The answer cannot be quality, because our corporate governance is not superior to Kenya, Vietnam, or India. It cannot be growth, because our listed
companies are not demonstrably growing faster than peers. It can only be the same captive liquidity that brought us to 38 times — more remittance money, more salary accounts looking for a home, more retail investors entering the market for the first time.
That liquidity-driven bull is certainly possible. Nepal’s history shows it — we have done it before, reaching 42.28 times at the peak of the 2021 bubble. But liquidity-driven rallies do not create fundamental value. They redistribute existing capital between early entrants and late arrivals. When the cycle turns, when interest rates rise, when capital account liberalisation creates an actual alternative, the adjustment is swift and painful for those who entered at the top.
This is not a call to stay out of the market. Nepal’s banking sector, the better-quality hydro projects with operational PPA revenues, and the handful of companies with genuine earnings growth remain worthy of patient capital. But entering the market with clear eyes - knowing that we trade at three times the frontier average, that our ROE does not support our P/B, that our dividend income is a fraction of what peer markets offer - is the difference between an investor and a speculator. Nepal
needs far more of the former and has, for too long, been creating the latter.
The global data is not cruel in its verdict. It is simply honest. We are an expensive market. We have been expensive for a long time. We will probably remain expensive until structural change arrives. The question for every Nepali investor is not whether the next bull market will come - it will - but whether the price you pay today leaves you any room when it does.
Article By: Ajay Kumar Shrestha