

Flags and Pennants in a Stock Chart and How to Make Money From Them
Thu, Feb 17, 2022 5:33 AM on Stock Market, Technical Analysis, Recommended, Exclusive,

Article by Samin Gurung, see disclaimer at the end of the article.
Flags and Pennants are very reliable bullish continuation patterns. All of us know what a flag looks like. However, since the word ‘Pennant’ isn’t used so often in Nepal, some may not know about it.
A pennant is simply a flag that becomes narrower at the edge. Perhaps a pictorial representation will make it all clear.

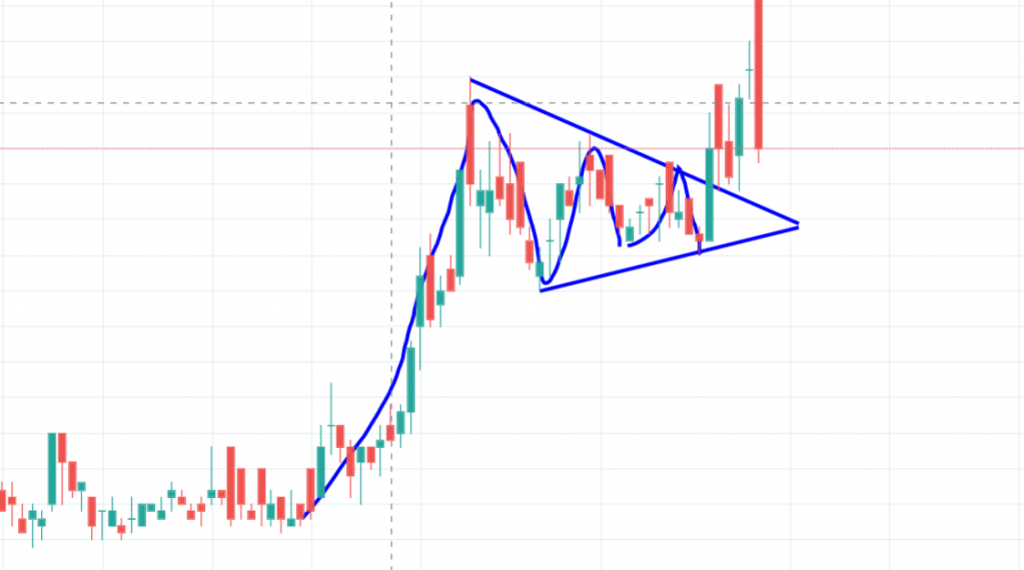
Flags and Pennants in a stock chart
Do not expect to see a perfect flag or a pennant in a stock chart. When chart readers talk about the formation of a flag in a chart, they are talking about price movement that looks like a flag.
Just to introduce you to the topic, the following is a flag/pennant pattern formed in a stock chart. We will discuss the topic in more detail after you analyze the chart.
Flags and Pennants are strong, decisive signals but they have only three identification criteria:
a) The flag should stand on a rapidly rising advance that forms the erect flagpole.
b) The volume should decline during the body formation, seemingly to nothing.
c) Then, a sudden surge in volume takes price in the original direction before the consolidation.
Tip: The criteria are the same in a pennant. However, activity (volume) diminishes rapidly in a pennant than in a flag.
In an advance, the flag body slants down, with each top lower than the last, and brought by smaller volume. In a decline (reverse flag), the body should slant upwards.
Furthermore, in an advance, the distance from the breakout point of the flagpole to the breakout point from the flag is the MINIMUM distance the stock will touch after breaking out from the flag.


Meanwhile, in a decline, the distance is the MAXIMUM.
Thus, one can buy at the breakout of the flag and expect to profit by holding till the point when the price reaches the target. Since that is the minimum target, investors may also hold longer to gain more and sell only at the appearance of sell signals.
More tips:
a) A flag is seen in the later part of a bullish move. Thus, once they form, know that it is also a warning that the bullish advance is near its final weeks.
b) A flag/pennant should not take more than four weeks to complete formation. Also, because of this, they do not form on weekly/monthly charts. Do not trust such pictures on longer-range charts.
Gurung is a media officer at Sharesansar who dedicates most of his office hours to reviewing article submissions, publishing news content, and interviewing the heads of companies listed on the exchange. Currently, he is binge-watching Shark Tank India, the business reality show.
Disclaimer: This article is a collection of notes from books written by hailed practitioners of technical analysis. Investing carries risk, and no strategy works 100% of the time. Reader discretion advised.
