
Decreased Volume This Week Indicates Reduced Investor Confidence Ahead of March 5 Polls
Sat, Feb 28, 2026 11:23 AM on Stock Market, National, Latest,

As the March 5 elections approach, trading turnover at the Nepal Stock Exchange (NEPSE) index is on a consistent decline, signalling weakening investor confidence.
Turnover dropped significantly throughout this week. On February 22, the first trading day (Sunday), total turnover stood at Rs 6.69 billion followed by Rs 5.13 billion on February 23 and Rs 4.23 billion on February 24.
Similarly, turnover stood at Rs 4.45 billion on February 25 before dropping to Rs 4.17 billion on February 26, the last trading day of the week.
With only two trading days remaining before the elections, experts observed that the noticeable decline in daily turnover has led to weakening market participation, low investor confidence and a possible market consolidation.
Although the market managed to post some gains on most trading days during the week, the falling volume indicates that these upward movements lacked strong investor support.
Analysts said reduced volume suggests that both buyers and sellers are not interested and the lack of demand causes the market to sink.
The selling pressure is not driven by panic, but by the lack of buying interest, pushing the market to move sideways, they said, adding that the market is currently in a consolidation phase, where shareholders are not ready to sell stocks at lower prices and buyers are hesitant to enter.
Despite minimal positive gains this week, the market has been under pressure. In the previous week, the market capitalisation decreased to Rs 4.444 trillions from Rs 4.484 trillions, forcing investors to lose Rs 40 billion as the index shed 28.92 points (1.08%) during the previous week.
On the first trading day of the current week, the market lost 27.59 points (1.04%). However, the remaining trading days recorded gradual gains totalling 40.36 points. Market capitalisation rose to Rs 4.466 trillions from Rs 4.444 trillions in the previous week, representing a recovery of Rs 22 billions.
According to technical analyst Ramhari Nepal, a falling index supported by declining turnover indicates a weak bearish trend. It signifies that the downward move is not supported by selling, but lacks buying pressure, leading to a continued price fall.
A falling index with high turnover signals a strong bearish trend driven by aggressive and panic selling while a rising index followed by falling turnover indicates a weak bullish signal, signalling weak buying interests and potential reversals.
Experienced trader Manges Dev Pandey said investors and traders are at present on a wait-and-watch situation due to election-related uncertainty.
However, he remains optimistic about positive market outlook post elections. “I have not found anyone who is negative about the market. I think most investors and traders are waiting for a good market push after polls,” said Pandey, who has over five years of trading experience.
He said the recent volume decline is not driven by panic selling, but it lacks buying interest.
Nepal echoed Pandey’s view, stating that uncertainty takes over during major events like elections. “It seems investors are confused about the scenarios post elections,” he said.
Technical perspective
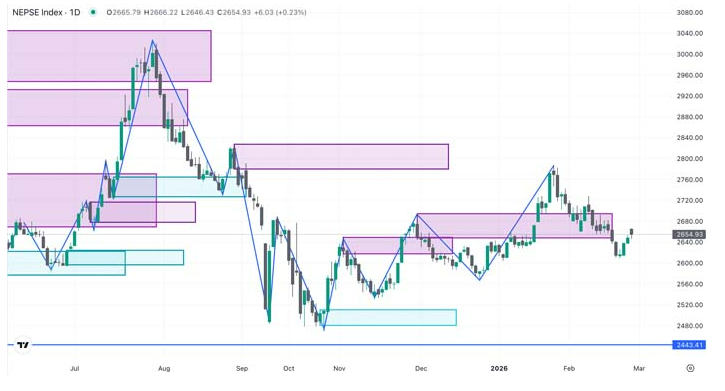
From a technical viewpoint, the index is hovering above its immediate support zone of 2630-2645. Breakdown below this level could push the market to the next support range of 2580 to 2600. Notably, the 2580-2600 level served as a strong support before the January rally and was tested in the third week of December, 2025.
On the upside the 2680 range serves as an immediate resistance with the market repeatedly failing to hold above it. Trading below the 20-day EMA (2,680) means the short-term trend is technically bearish.
The 2780-2800 level serves as a strong resistance. During the first three months of 2026, sellers became increasingly active whenever the market touched the 2800 level, indicating that the point acts as a supply zone where investors are booking profits.
Momentum Indicators
RSI (Relative Strength Index): Currently the daily RSI stands at 47.99 and the weekly RSI is at 50.24. These readings suggests that the market isn't oversold (30) nor overbought (70), indicating a lack of clear momentum.
MACD (Moving Average Convergence Divergence): The MACD remains below zero, with the signal line at -8.19. This confirms the underlying bearish-to-neutral sentiment continues to persist.
Moving Averages: The index is trading below both the 20-day exponential moving average (EMA) and the 5-day EMA, indicating a short-term bearish sentiment.
