

Chilime Hydropower Company Limited (CHCL): An Eleven-Year Financial Performance Review (Q4 2072/73 - Q4 2082/83)
Fri, Aug 14, 2026 12:21 AM on Financial Analysis, Company Analysis, SS Pro, Latest,
.png)
Company’s Short Background
Chilime Hydropower Company Limited (Chilime) was incorporated in 1995 with the objective of generating hydroelectricity through the optimal utilization of resources within the country. Nepal Electricity Authority (NEA) holds a majority ownership with a 51% shareholding. The remaining 49% shareholding is held by the public, including 10% equity ownership by local people.
Chilime owns and operates a 22.1 MW power plant, commissioned on August 25, 2003, and located in Rasuwa District, 133 km north of the capital city, Kathmandu. It sells bulk electricity to NEA at a long-term PPA price. The annual energy generation from the plant is about 150 GWh.
Share Capital and Share Issuance Arrangement
At the time of the company’s establishment, an amount was collected from the Nepal Electricity Authority (NEA) as share capital. At that time, the company received Rs. 48.96 crore against 48 lakh 96 thousand shares.
Subsequently, in the second phase, in 2063 B.S., the company issued shares to the company itself, NEA employees, former employees, and directors, equivalent to 25%, or 24 lakh shares, and collected Rs. 24 crore.
Thereafter, in the third phase, shares were issued to project-affected local residents and the public. In this phase, the company issued 1 lakh 80 thousand shares at Rs. 100 per share to local residents, while the remaining 15 lakh 69 thousand 600 shares were issued at a premium price, generating the corresponding share capital. The company has so far distributed bonus shares equivalent to 9.15 times.
Balance Sheet
Assets
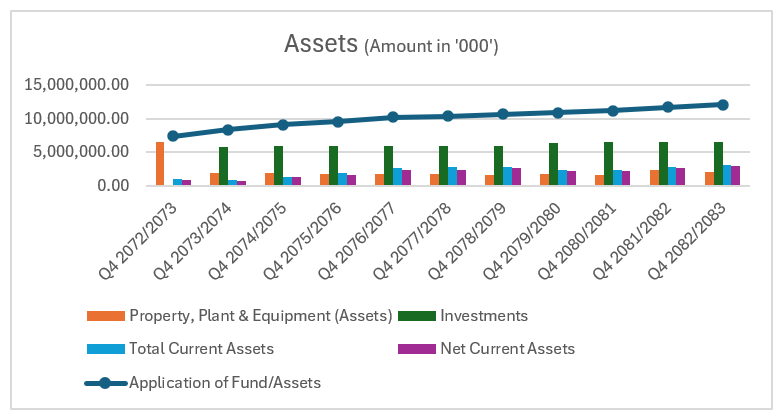
1. Property, Plant & Equipment - Net Block (Net Fixed Assets)
The net block stood at Rs. 7.43 billion in the initial period and gradually increased to Rs. 12.06 billion. Overall, net fixed assets increased by approximately Rs. 4.63 billion, or 62.35%, over the review period.
2. Investments
Investments remained the highest component of the company’s total assets. CHCL’s investment had not started until the base year taken for this study, Q4 2072/73. The company suddenly started investing a high value of Rs. 5.74 billion, which then increased to Rs. 6.59 billion. The investment portfolio of CHCL seemed to be in an increasing trend.
3. Total Current Assets
Total current assets show an increasing trend. The latest figure represents a significantly liquid position. Current assets of CHCL are around 26 times higher than current liabilities. Now, it would be better to invest or utilize these funds to generate returns. Current assets increased by approximately three times from the base year.
Liabilities
1. Sources of Fund/Capital & Liabilities
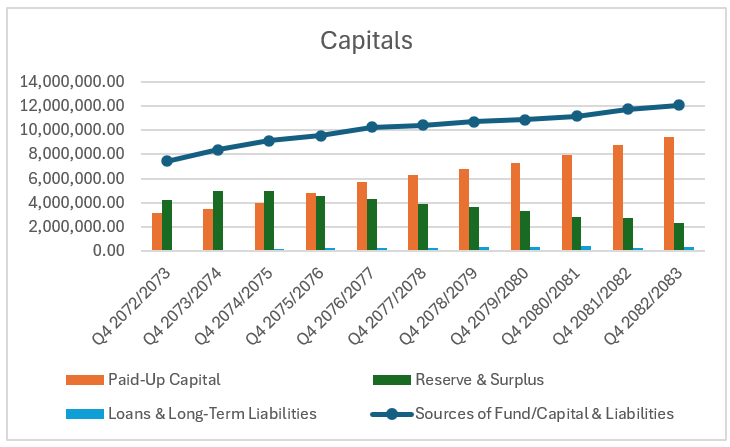
The company’s total sources of funds increased from approximately Rs. 7.43 billion to Rs. 12.06 billion, representing an increment of around 62.35%. The increment in total funds appears to be largely associated with the increase in share capital.
2. Paid-Up Capital
Paid-up capital is in an increasing trend because of the dividends distributed by CHCL. As of the initial year, Q4 2072/73, taken for the study, paid-up capital stood at Rs. 3.13 billion and increased by an average of 12% annually.
3. Reserve & Surplus
The reserve and surplus position shows one of the most notable changes. The company initially had a strong reserve position, meaning accumulated retained earnings. It then continuously used the reserve to distribute dividends, causing the reserves to erode over the period. The reserve of CHCL was Rs. 4.98 billion as of Q4 2074/75, which declined to Rs. 2.26 billion as of Q4 2082/83.
4. Loans & Long-Term Liabilities
CHCL has used negligible loans and long-term liabilities. CHCL keeps loans below around Rs. 40 crore. This is a minimal portion of its capital funds. In simple terms, the company is not dependent on borrowed money.
5. Total Current Liabilities
Investments remained relatively strong compared with the company’s total assets.They increased by approximately Rs. 850.10 million throughout the period.
Profit and Loss Account
1. Operating Income
Operating income increased from Rs. 1.24 billion in the initial period to Rs. 1.33 billion in the latest reported period. This represents an increase of approximately 7.33%.
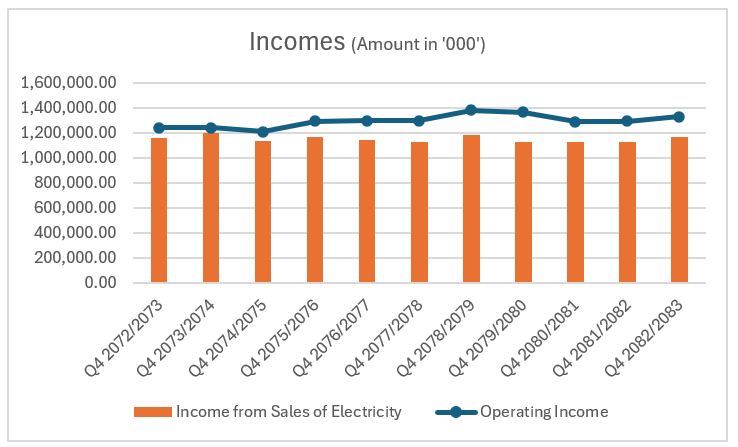
The growth in operating income was primarily driven by income from other sources. Income from electricity remained relatively stable. As of Q4 2072/73, income from sales of electricity was Rs. 1.163 billion, and as of Q4 2082/83, it remained almost the same at Rs. 1.167 billion. At the same time, income from other sources increased from Rs. 77.24 million to Rs. 163.78 million, almost doubling during the period. This indicates that CHCL’s return from investments is in an increasing trend.
2. Income from Sales of Electricity
Income from sales of electricity is the primary source of revenue for the company and provides a clear indication of the operating performance of its hydropower project. The company’s electricity sales have remained strongly stable over the review period.
3. Operating Expenses and Non-Operating Expenses
Operating expenses have generally seemed under control. Meanwhile, they are in an increasing trend. Excluding the initial figure, operating expenses increased from Rs. 186.04 million to Rs. 339.30 million over the reviewed period.
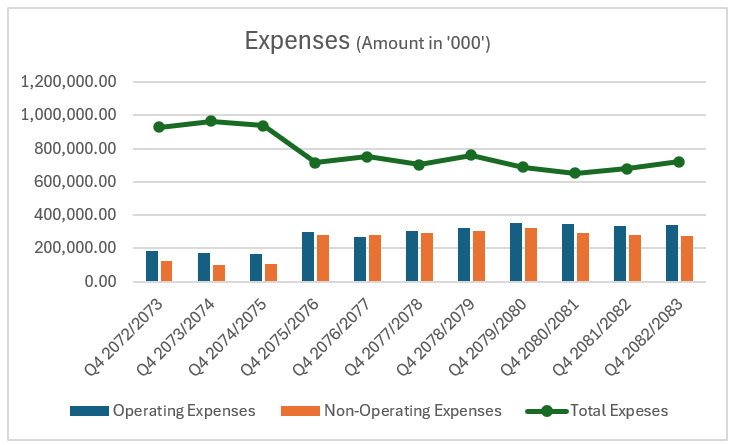
Non-operating expenses of CHCL seemed to be increasing exponentially. As of Q4 2072/73, they stood at Rs. 12.43 million and increased to Rs. 272.05 million as of Q4 2082/83. This is because the depreciation rate of property, plant and equipment is on the higher side as the project gets older. The other component of non-operating expenses, i.e., financial expenses, is nil.
4. Net Profit
The company reported a net profit of Rs. 929.98 million in Q4 2072/73. The company then earned its highest profit of Rs. 966.31 million in 2073/74. Afterward, CHCL’s net profit seemed to be in a declining trend. CHCL earned a net profit of Rs. 720.05 million as of Q4 2082/83.
Major Indicators
1. Net Worth per Share (Rs.)
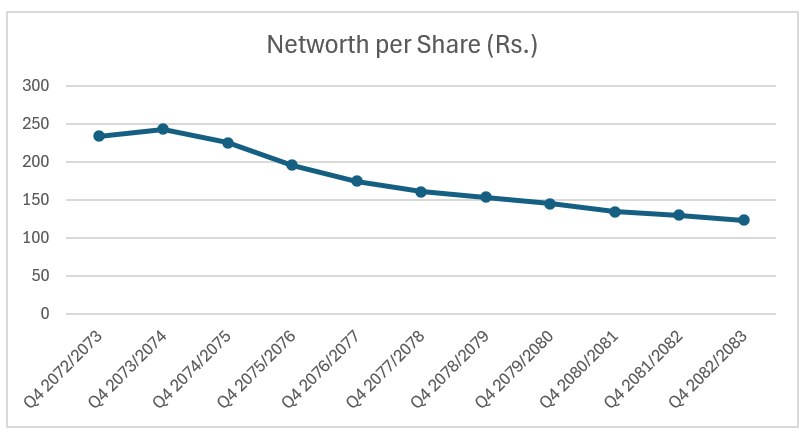
Net worth per share of CHCL peaked at Rs. 234.36 in Q4 2073/74 and then kept falling to Rs. 123.9 in Q4 2082/83. This is because the company distributed dividends from reserve funds.
2. Earnings per Share (EPS Annualized - Rs.)
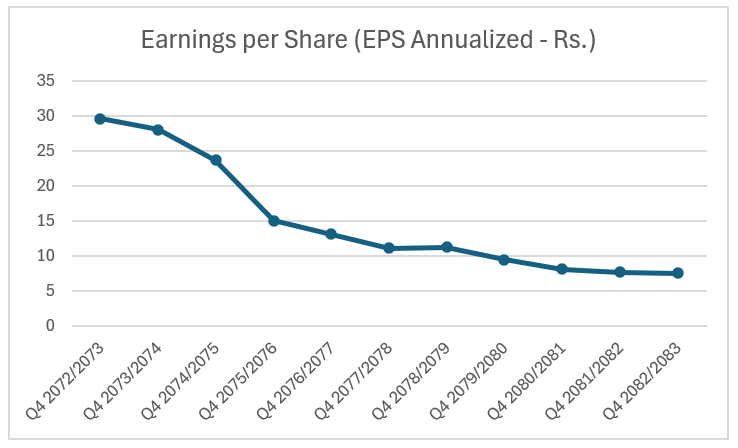
EPS showed a similar pattern to NWPS. The company’s EPS peaked in Q4 2072/73 by achieving an EPS of Rs. 29.67 and then continuously declined to Rs. 7.59. This is because CHCL capitalized reserves and earnings by distributing stock dividends and reducing them through cash dividends, while earnings did not increase due to the limited fixed PPA and power generation.
3. Debt - Equity Ratio
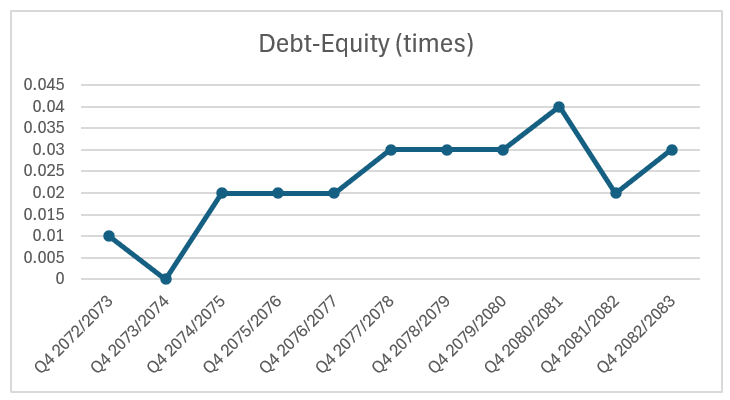
The Debt - Equity ratio compares total liabilities to shareholders’ equity and indicates how much a company is leveraged. CHCL seems to use negligible debt and has not taken on any significant debt-related burden.
4. Current Ratio
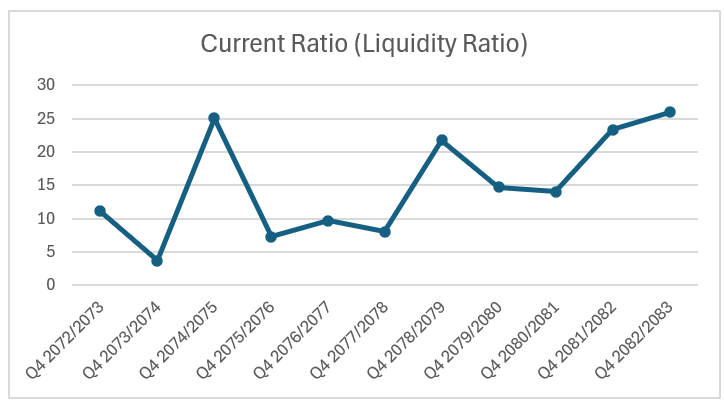
The current ratio is a liquidity ratio that measures whether a company has enough current assets to cover its short-term liabilities. CHCL has excess short-term capital to cover its short-term liabilities.
5. Return on Equity (ROE)
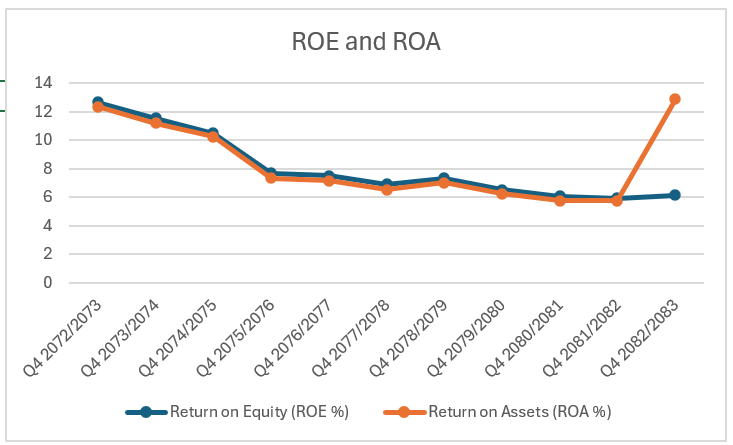
ROE shows how efficiently a company generates profit from shareholders’ money. The company’s ROE was 12.36% in Q4 2072/73. It then gradually fell until Q4 2081/82, reaching 5.73%, before rebounding to 12.88% as of Q4 2082/83.
6. Return on Assets (ROA)
ROA measures how effectively the company uses its total assets to generate profit. The company’s ROA was 12.66% as of Q4 2072/73 and kept declining to 5.93% as of Q4 2081/82. The latest ROA of 6.13% represents a marginal rebound in Q4 2082/83.
Data Source: The data used in this article has been obtained from SS Pro by ShareSansar.

