

Avoid Huge Losses in NEPSE, Use the Head and Shoulders Pattern
Sun, Oct 17, 2021 6:43 AM on Stock Market, Recommended, Exclusive,
In NEPSE, the head-and-shoulders pattern is a common occurrence during the reversal of trends. As common as it may be, the signal is equally reliable.
First, what you need to know about trend reversals
It is the tendency of investors to believe that the present trend will continue forever. However, a terrific stock can become terrible, and if an investor does not see it coming, he will lose while the stock plunges and ultimately kills his investment dreams.
Luckily, whenever a trend reverses, it gives signals.
A trend reversal rarely happens in a single day. The stock market is the combined consensus of thousands of investors. Since their combined actions have a certain momentum, any movement in the stock price takes time to change course.
The stock movement of a company is like a speeding truck. The speeding truck cannot stop suddenly, and in the same fraction of a second, reverse its direction at the same speed. It takes time to bring the truck to a halt and accelerate in the opposite direction.
And this is exactly what makes a reversal signal predictable.
Notes Before Starting
1) The Head and Shoulders Pattern also has a bullish counterpart, one that comes at the end of a downtrend and signals the formation of an uptrend. This article is not related to the current trend of the stock market, and it is not a prediction.
2) Patterns that look like the Head and Shoulders Pattern may also form during sideways trends. However, they are of little significance and are thus omitted from the discussion in this article.
3) Although the Head and Shoulders Pattern may form at a shorter or a longer timeframe, the pattern is of significance when it forms in the approximate time span of 3 months.
What is the Head and Shoulders Pattern

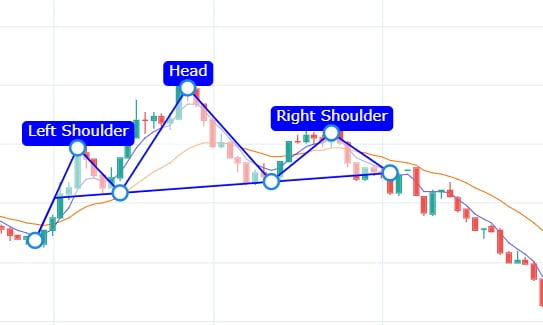
The head and shoulders pattern forms at the end of an uptrend. This means that the reversal of a trend is symbolized by the appearance of this pattern.
This pattern looks exactly like what its name suggests. The first part is a small peak, which resembles the left shoulder of the human body. The second part is a higher peak, which resembles the head. And the third and final part is another peak, which is lower than the “head,” making the combined pattern look like a head with two shoulders on either side.
How to correctly identify the head and shoulders pattern
Like in any technical analysis tool, there is a logical reason why the head-and-shoulders pattern signals a trend reversal.
But first of all, let me list the requirements that make a pattern the head-and-shoulders pattern:
The left shoulder: The stock advances higher. Compared to other times, significantly greater volume accompanies the uptrend. However, the stock cannot stay up for long, and it goes down, sometimes immediately. The volume declines while falling. The left shoulder most commonly looks like a peak.
The Head: After falling down during the left shoulder formation, the stock then retraces upwards and forms a higher high. The volume increases, better if it is higher than the first surge. The price then comes down like before with lower volume. Note that this downwards pullback should bring the price below the left shoulder’s peak.
Right shoulder: The price goes up but in far less volume than the previous two bullish rallies. The stock fails to create a higher high than the peak of the head and eventually comes down.
You should analyze volume with great importance in the head-and-shoulders pattern formation.
Now, why does the head and shoulder pattern work
The head and shoulders pattern is not a secret formula given by God. It works because it tells a story about market psychology.
The first upwards surge of the left shoulder means that investors are bullish on the stock. Since this is accompanied by a huge surge in volume, the optimism is pretty strong.
Then, the stock comes down with low volume. This means that early buyers want to take profit and leave the stock. In investing terms, this is called a pullback. However, since the volume is low, there are only a limited group of investors who are bearish on the stock.
Now, the stock rises again, this time with higher volume, and forms the peak of the head. Since this is accompanied by a higher volume, more investors are bullish again. But the price declines again with low volume.
Then, in another attempt to push the stock higher, the bulls try to raise the price. However, they fail to create a higher high than the top of the head. This clearly means that investors who were bullish on the stock gave all they could but failed to create a higher high.
I also said that the volume in the third upward surge should be lower than the first two surges. This signals that the bulls are getting weak.
Now, if high volume appears on the final downwards dump, you’re done with this stock. Sell, sell, sell.
Even if the volume is low, understand that this stock will get boring for a considerable amount of time. Your money has better potential to grow in another stock.
See? Technical analysis is not really technical. It is a visual representation of how the overall market thinks, feels, and reacts.
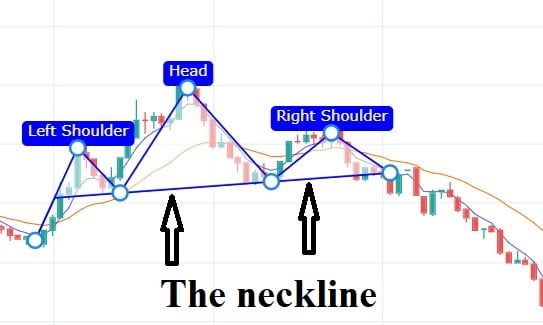
The neckline enhances your understanding of the action
The lows of the shoulders and the heads can be joined by a straight line in the majority of the cases. Nevertheless, if the lows don’t fall in line, you can draw an approximate line that best joins them. Technical analysis is an art and not a rigid science.
You can take a lot of valuable information from a neckline.
The head-and-shoulders pattern is confirmed only after the stock price comes below the neckline. This is called a breakout, meaning that the bearish downtrend has started.
When the final dump of the right shoulder has a higher volume, this means that the stock is pulled down with more strength. However, if this final dump is accompanied by a lower volume, the stock might retrace to the neckline even after a breakout. Don’t take this as a bullish reversal signal. Just take this as the stock’s final gasp before it plunges.
Nevertheless, in both cases, a downtrend is happening.
The neckline also enables you to roughly estimate how low the price will fall. Take the vertical distance from the peak of the head to the neckline. Then take the same vertical distance down from the point where the price breaks down the neckline. This bottom level is the objective of the decline.
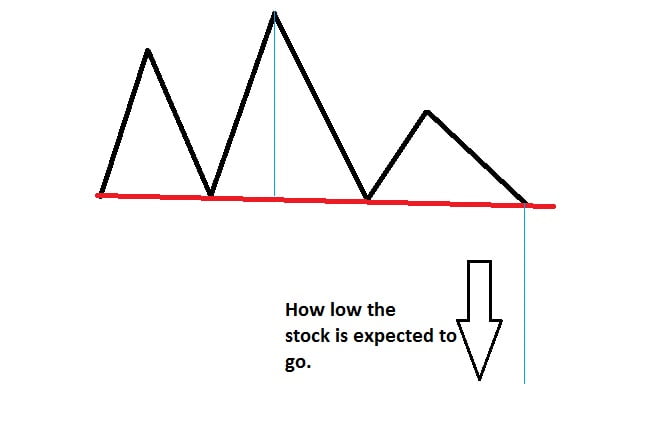
An objective is a level up to which a stock chart will likely reach. After it reaches there, supply and demand might come to an equilibrium, eventually stabilizing the price movement.
Another way to estimate the objective is to have a bird eye’s view of how much the stock gained during the head-and-shoulders pattern compared to the level before it formed. In other words, the reversal pattern after the pattern should have something to reverse. The higher the stock gained during the head-and-shoulders pattern formation, the more it’ll lose during reversal.
How accurate is the head-and-shoulders pattern?
About 20% of the head-and-shoulders patterns are saved, meaning that the price won’t go down but will be dull over some period and continue the advance.
However, now that I think of it, it is better to sell after the head-and-shoulders pattern appears anyway. This is because the stock will either fall or become unattractive. If you sell and it falls, good for you. If you sell and the trend just becomes dull, good for you again. This is because you can invest your money in some other stock that is more attractive. You can come back later if this stock shows signs of bullish continuation.
The head-and-shoulders pattern is very accurate. Once it forms, sell even though the news or the market psychology tells you otherwise.
Also read: Can the Head and Shoulders Pattern also predict an uptrend?
What else do you need to know?
The pattern may not always be symmetric. The right shoulder might not be a reflection of the left. However, the right shoulder must pull back below the top of the left shoulder.
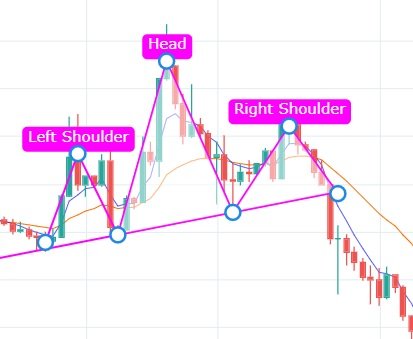
Also, the neckline is sometimes slanted. The down-slanting neckline is an even stronger downward signal. An upward slanting neckline is investors incorrectly believing the uptrend will continue. However, it is a downward signal as well.
