- Sudarshan Kadariya, New York
Our investing and trading experience help us to build our trading behavior knowingly or unknowingly over the time. With the repeated actions of buying and selling securities, we laid the foundation to build our trading behavior. Every investor in the stock market has his/her own trading habits and their strategies. Some investors prefer to write down their trading rules and follow them religiously with regular updates and upgrades as per its trading outcomes. On the other hand, the stock market performance is largely based on the market information of the listed stocks and based on the collective trading behaviors of the market participants. Every day, there is good news, bad news and no news on the listed stocks but most of the listed stocks have their daily price actions regardless of market information.
Some investors like to take stock market is like to see as battlefield among the ideas, strategies, behaviors, etc of the market participants. In other words, it is like a laboratory where investors test their raw ideas and try to prove their ideas into investing/trading skills to make money. Everyone come to the market to make money but only a few of the short-term traders are able to make money from the market and most of the traders mostly beginners tend to lose money in the market until they develop their own profitable trading rules i.e. the clear idea of when to buy and when to sell a stock to make money. Some of the beginner traders seek advice and suggestions from local market experts and technicians as well. Also, we can see people are seeking advice in social platforms! There are many experts and technicians in the market but most of them also try to understand the behavior of the financial market which is not an easy thing to understand. The psychology of the market and the investors are very complex which is completely unpredictable by its nature. Nobody can predict the next move in the market when it opens in the next morning. Predicting a stock price movement is something out of the scope of the financial communities in the world. It is just an amazing mechanism to practice with some wins with some losing results all the times for all the investors.
But, the scholars and practitioners in the market can always give their educated guess about the price movements based on the analysis of facts and figures with their experience. Even though, the historical information in the market cannot predict the future course of action in the dynamic business environment. One of our study shows that only 3 years of historical data can be used for the financial analysis.
Here, we are trying to show you month as an indicator for buying and selling opportunities. We are analyzing best performing month of the year vs. worse performing month of the year during a window of a year starting from January to December. We are taking market indices as an indicator of market performance. We use S&P 500 index which is the index of top 500 companies from US stock market and NEPSE index, a composite stock market index in Nepal for the purpose to compare its behaviors. We have collected the daily index data for last 20 years for S&P 500 and NEPSE, and based on certain assumptions, we come to the following conclusions.
Table I indicates the corresponding month of minimum and maximum market index in a year. For example, S&P 500 was lowest in Jan and Highest in Dec in 1998 whereas May was the lowest and Dec was the highest for NEPSE. With this analysis, we are trying to get an idea on which month is a suitable to enter into the stock market or, buying stocks? And, which month is the best month to sell the stocks? This analysis is just an overview of the ideas rather than a trading/investing suggestions but one can deploy their further analysis to find further details to build their own investing strategies i.e. a rule to control your own emotions.
Table I: Month of the year from 1998 to 2017, S&P 500 and NEPSE Indices touch its Minimum and Maximum level
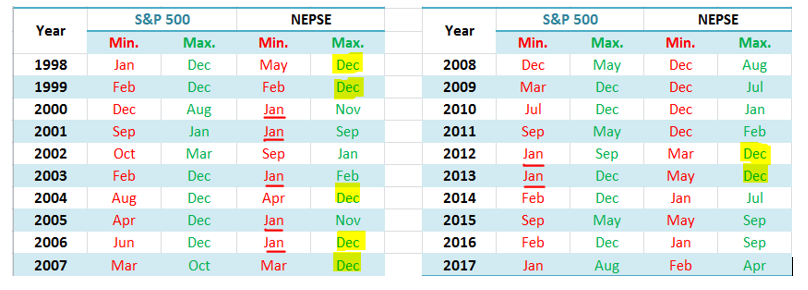
Table II shows the month-wise counts of maximum and minimum for S&P 500. Table I exhibit that December appeared 11 times followed by May i.e. stock market indices on an average were high in December (11 times out of 20 years) which gives us an idea that December is the month to selling stocks. On the other hand, January and February appeared lowest 4 and 4 times respectively which is an indication that the first quarter is the right time to buy stocks i.e. the market perform its lowest level in a year. Please note that these counts are made by averaging monthly data of S&P 500 index during the analysis period.
Table II: Month of the year when S&P 500 Index touch the yearly Highest and Lowest level for the period 1998 to 2017
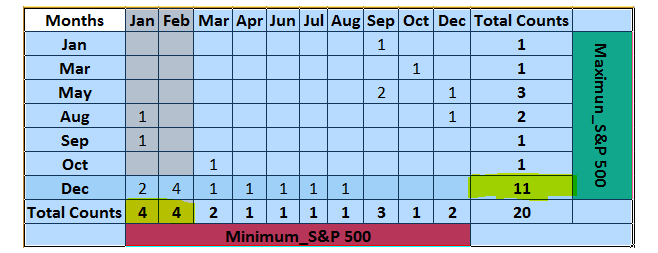
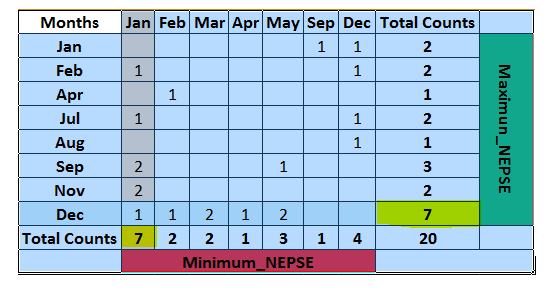
Table III is the presentation of NEPSE index with its yearly high and low level and the counts of the corresponding months. Consistent with S&P 500 performance, NEPSE also reached its highest level in December 7 times out of 20 years followed by September but the frequency is lower than S&P 500 (11 vs. 7). On the other hand, January is the month of the lowest performance of NEPSE index. Total 7 times out of 20 years, NEPSE went to its lowest level in January followed by December. These figures indicate that December and January every year are the most important months for stock investors for their investment decisions both in US and Nepalese financial markets. But, there is no clear indication of second entry and exit month in both markets during the analysis period.
Table III: Month of the year NEPSE Index touch the yearly highest and lowest for the period 1998 to 2017
 Bottom line:
 In the financial market in the world no one can precisely predict the future stock market movements but you can always find people who give their opinions about the markets. But, always keep in mind that no one can compensate you if you lose money following their advice! The stock market is the mechanism where you have to develop your own skills to perform better which is possible with careful actions in trading and investing decisions over the longer period of time. Obviously, it takes time but it is possible with consistent and regulated efforts to train you for the profitable trading/investing results. It requires you a lot of efforts and self-control on your emotions over your trading activities/decisions.
Here, we have presented the historical performance of S&P 500 and NEPSE over past 20 years to find out an idea with regards to when to buy a stock and when to sell in a year (period of January to December). Based on the analysis of data from 1998 to 2017, December is considered as the month to sell the stocks and January is the month to buy the stocks aiming to hold at least until December of the year. There are inconsistent indications for the second entry and exit months in a year based on the frequencies appeared in the above tables. This analysis is based on multiple assumptions which could be the limitations of this article but in general, we can reach to the conclusion that if we buy a stock in January and keep it until December, we can make some money for the majority of the cases. But, we always have to keep in mind that the stock market is the most fragile and dynamic mechanism for traders and investors and its movements are not predictable yet all by its nature!
(*The author is a Gold medalist in M. Phil in Management with specialization in Finance in 2012, Tribhuvan University. Now, he works for a consulting firm in New York. The opinion presented in the article is personal. You can reach to the author at su.kadariya@gmail.com)


